

Here you will find monthly and yearly Canadian and U.S. sales figures for the Scion FR-S and its successor, the Toyota 86. Use the dropdown at the top right of this page or at GCBC’s Sales Stats home to find sales figures for any other vehicle currently on sale in North America.
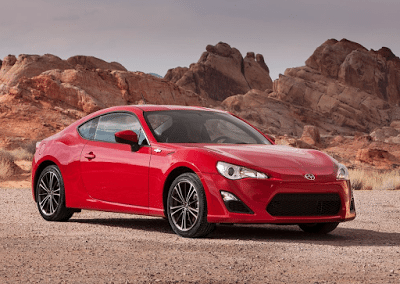
Toyota 86 – US Sales Figures
Toyota 86 – US – Month
| Year | Jan | Feb | Mar | Apr | May | Jun | Jul | Aug | Sep | Oct | Nov | Dec |
|---|---|---|---|---|---|---|---|---|---|---|---|---|
| No data available in table | ||||||||||||
| ∑ = | ∑ = | ∑ = | ∑ = | ∑ = | ∑ = | ∑ = | ∑ = | ∑ = | ∑ = | ∑ = | ∑ = | |
Toyota 86 – US – By Year
Toyota 86 – Canada Sales Figures
Toyota 86 – Canada – Month
| Year | Jan | Feb | Mar | Apr | May | Jun | Jul | Aug | Sep | Oct | Nov | Dec |
|---|---|---|---|---|---|---|---|---|---|---|---|---|
| No data available in table | ||||||||||||
| ∑ = | ∑ = | ∑ = | ∑ = | ∑ = | ∑ = | ∑ = | ∑ = | ∑ = | ∑ = | ∑ = | ∑ = | |
Toyota 86 – Canada – By Year
° including Toyota 86
See the Scion FR-S compared with its rivals in the monthly Sporty Car Sales charts on GoodCarBadCar.net
RELATED
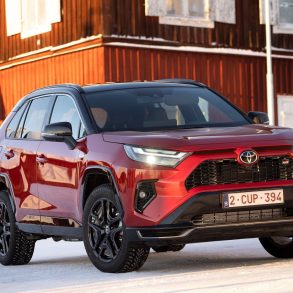
Toyota Motor Corp. • Scion Brand • FR-S • iA • iM • iQ • tC • xA • xB • xD • Toyota Brand • 4Runner • 86 • Avalon • Camry • Celica • C-HR • Corolla • Corolla iM • FJ Cruiser • Highlander • Land Cruiser • Matrix • Mirai • MR2 Spyder • Prius • Prius C • Prius Prime • Prius V • Prius Family • RAV4 • Sequoia • Sienna • Tacoma • Tundra • Venza • Yaris • Yaris iA


for a deep insight into the making of Scion's FR-S visit http://goo.gl/3KRj8)