Chevrolet TrailBlazer
Here you will find yearly Canadian, Chinese and U.S. sales figures for the Chevrolet TrailBlazer. The Chevrolet TrailBlazer is an SUV produced by the American automobile manufacturer Chevrolet, a division of General Motors (GM). The TrailBlazer nameplate has a history that spans several years and has been applied to different types of vehicles, depending on the market and period.
Chevrolet TrailBlazer Overview
In 2012, Chevrolet reintroduced the TrailBlazer name for a new mid-size SUV based on the same platform as the Chevrolet Colorado pickup truck. This version of the TrailBlazer was aimed primarily at emerging markets and was sold in regions like Southeast Asia, South America, and others. This version was completely different from the U.S. TrailBlazers of the 2000s, with different styling, features, and engine options.
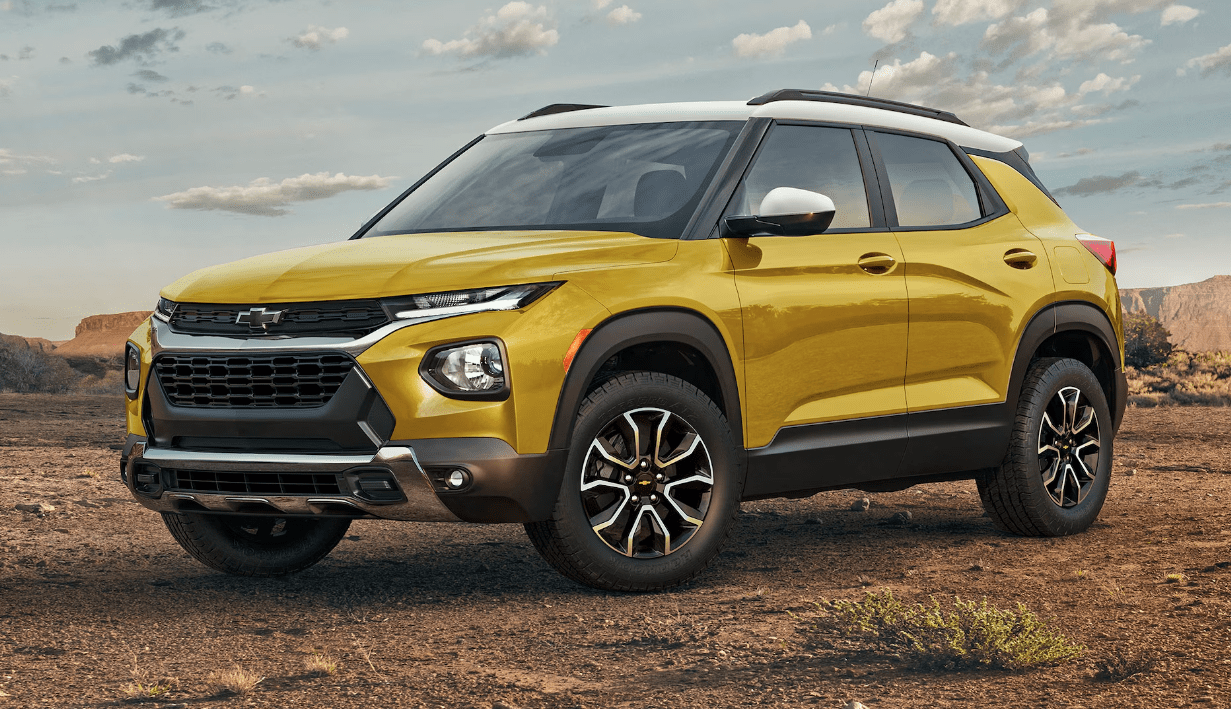
Chevrolet revived the TrailBlazer nameplate for the U.S. market in 2021 as a subcompact crossover SUV, positioned between the Chevrolet Trax and Chevrolet Equinox in size and price. This modern TrailBlazer has little in common with its predecessors in terms of size and market positioning but seeks to leverage the historical recognition of the name.
The Trailblazer is available in three trim levels: LS, LT, and RS. All trim levels are powered by a turbocharged 1.3L Ecotec engine that produces 155 horsepower and 174 lb-ft of torque. It is mated to a 9-speed automatic transmission. The Trailblazer has a starting MSRP of $23,100.
Chevrolet TrailBlazer Sales Figures
Chevrolet TrailBlazer U.S Sales Data & Charts
US Monthly Sales
| Year | Jan | Feb | Mar | Apr | May | Jun | Jul | Aug | Sep | Oct | Nov | Dec |
|---|---|---|---|---|---|---|---|---|---|---|---|---|
| 2005 | 10,867 | 15,974 | 20,717 | 17,733 | 22,556 | 30,532 | 28,922 | 22,251 | 21,412 | 13,910 | 15,540 | 23,736 |
| 2006 | 13,479 | 13,683 | 16,224 | 12,792 | 15,573 | 20,261 | 13,805 | 12,901 | 15,328 | 14,451 | 13,946 | 12,354 |
| 2007 | 9,368 | 10,838 | 11,426 | 10,576 | 12,077 | 8,202 | 14,547 | 13,747 | 12,669 | 11,310 | 7,794 | 12,072 |
| 2008 | 8,379 | 10,218 | 5,253 | 2,858 | 3,409 | 10,516 | 3,952 | 11,923 | 8,773 | 3,954 | 2,556 | 4,087 |
| 2009 | 2,461 | 1,040 | 1,083 | 815 | 739 | 1,004 | 580 | 368 | 250 | 210 | 165 | 114 |
| 2010 | 66 | 22 | 37 | 19 | 10 | 51 | 2 | 4 | 2 | 2 | 1 | 2 |
| 2011 | 9 | 2 | 0 | 0 | 0 | 22 | 0 | 0 | 0 | 0 | 0 | 0 |
| 2020 | 1 | 1 | 1 | 1,206 | 2,680 | 2,814 | 3,619 | 3,217 | 3,485 | 5,825 | 4,785 | 6,658 |
| 2021 | 8,008 | 8,008 | 9,009 | 7,882 | 7,579 | 7,882 | 8,617 | 8,298 | 8,617 | 5,421 | 5,421 | 5,421 |
| 2022 | 2,754 | 2,754 | 3,098 | 5,447 | 5,245 | 5,245 | 5,723 | 5,943 | 5,723 | 6,319 | 6,066 | 6,571 |
| 2023 | 9,194 | 8,827 | 9,930 | 11,432 | 10,993 | 11,432 | 9,830 | 10,617 | 10,224 | 6,097 | 6,097 | 6,341 |
| 2024 | 7,963 | 7,963 | 8,282 | 9,056 | 9,418 | 9,418 | 9,740 | 10,909 | 8,961 | 6,691 | 7,854 | 8,145 |
| ∑ = 72,549 | ∑ = 79,330 | ∑ = 85,060 | ∑ = 79,816 | ∑ = 90,279 | ∑ = 107,379 | ∑ = 99,337 | ∑ = 100,178 | ∑ = 95,444 | ∑ = 74,190 | ∑ = 70,225 | ∑ = 85,501 |
US Annual Sales
US Annual Growth
Chevrolet TrailBlazer Canada Sales Data & Charts
Canada Annual Sales