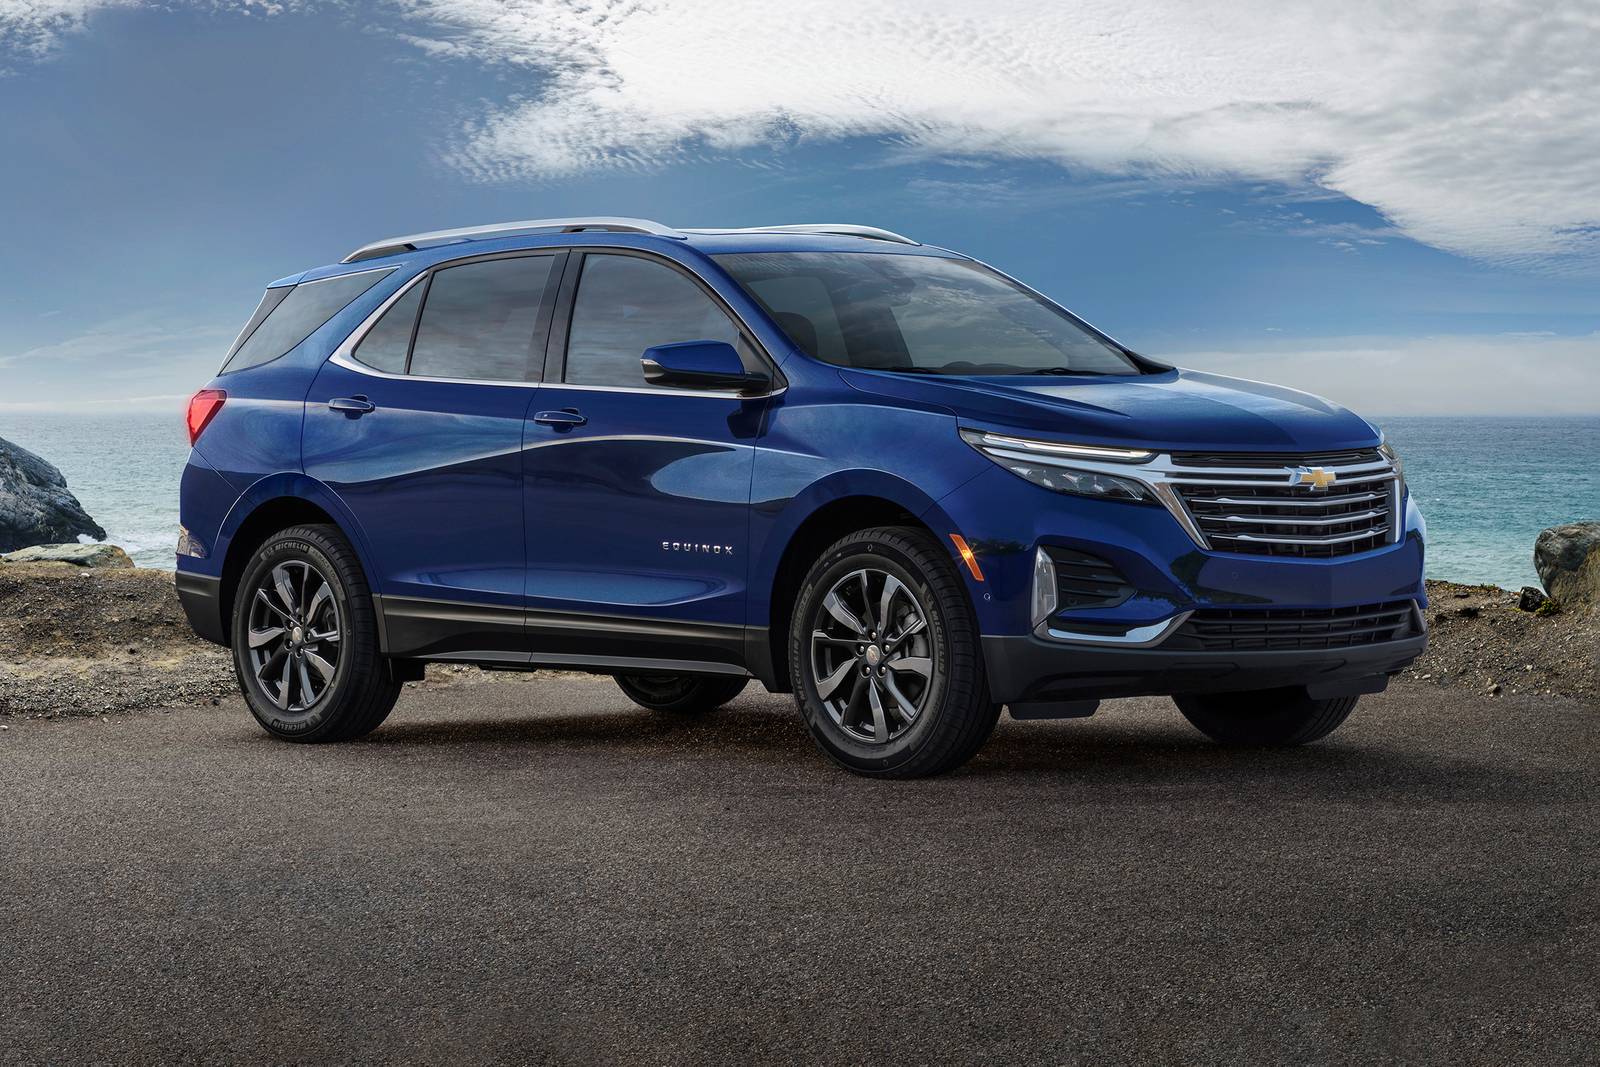
Chevrolet Equinox
Here you will find monthly and yearly Canadian, U.S and Chinese market sales figures for the Chevrolet Equinox. The Equinox is the model that may save Chevrolet in China. From 2015 until early 2017, the American brand was in a non-stop decline in the world’s largest and fast-growing car market, but launching a brand new locally produced crossover put the brand immediately back on the radar of car buyers. The Equinox is based on the Buick Envision, which has been produced in China since 2015 and is even exported to the US. It replaces the Captiva, which appears to have gone out of production in 2017.
Chevrolet Equinox Overview
The current Chevrolet Equinox is a compact crossover SUV that was first introduced in 2021 and is based on the GM C1XX platform. It is available in both gasoline and hybrid models. Gasoline-powered models are powered by a 1.5L turbocharged four-cylinder engine that produces 170 horsepower and 203 lb-ft of torque. Hybrid models are powered by a 1.5L turbocharged four-cylinder engine and an electric motor that produce a combined 252 horsepower and 273 lb-ft of torque. All models come standard with front-wheel drive, but all-wheel drive is available.
The Chinese Equinox is powered by either a 1,5T with 180hp/275Nm mated to a 6DCT or the same 2.0T with 260hp/350Nm, mated to GM’s latest “Hydra-Matic” 9-speed AT. Dimensions are 4.652/1.843/1.693mm with a 2.725mm wheelbase. GM is rumored to be considering a China-only 7-seater version Equinox L, but this has not yet been confirmed. Prices run from 174.900 yuan to 249.900 yuan (€22.700,- / US$25,400 to €32.400 / US$36.300), well below the more premium Envision (starting at 209.900 and up to 349.900), which sells an average of 21.400 units a month and spot on with rivals like the Honda CR-V and Nissan X-Trail (both start at 179.800 yuan) and the Ford Kuga (184.800 yuan).
Chevrolet Equinox Sales Figures
Chevrolet Equinox U.S Sales Data & Charts
US Monthly Sales
| Year | Jan | Feb | Mar | Apr | May | Jun | Jul | Aug | Sep | Oct | Nov | Dec |
|---|---|---|---|---|---|---|---|---|---|---|---|---|
| 2005 | 8,826 | 9,335 | 11,616 | 11,873 | 12,118 | 17,217 | 17,571 | 10,014 | 8,987 | 6,094 | 7,024 | 9,867 |
| 2006 | 6,161 | 7,808 | 8,637 | 12,583 | 10,233 | 10,909 | 13,002 | 11,622 | 8,573 | 7,380 | 7,802 | 9,178 |
| 2007 | 5,325 | 7,574 | 9,997 | 7,113 | 6,594 | 5,080 | 7,516 | 13,186 | 8,224 | 5,978 | 5,261 | 7,704 |
| 2008 | 7,865 | 8,674 | 6,450 | 5,851 | 5,850 | 7,411 | 6,095 | 4,561 | 3,532 | 2,841 | 2,570 | 5,747 |
| 2009 | 5,403 | 3,462 | 4,361 | 4,128 | 3,689 | 4,108 | 10,834 | 13,157 | 6,840 | 7,868 | 9,587 | 12,711 |
| 2010 | 9,513 | 8,061 | 12,805 | 11,987 | 13,134 | 11,490 | 9,869 | 10,538 | 11,658 | 12,773 | 15,387 | 22,764 |
| 2011 | 12,847 | 15,434 | 14,949 | 17,067 | 17,587 | 17,954 | 17,094 | 16,606 | 15,497 | 15,108 | 14,936 | 18,195 |
| 2012 | 13,662 | 35,702 | 20,064 | 18,282 | 20,238 | 20,793 | 19,906 | 20,231 | 15,835 | 15,387 | 16,821 | 19,551 |
| 2013 | 17,223 | 20,649 | 20,997 | 20,965 | 22,918 | 23,645 | 18,507 | 25,073 | 15,443 | 17,163 | 18,397 | 17,212 |
| 2014 | 14,547 | 21,587 | 19,939 | 20,315 | 22,695 | 21,748 | 25,231 | 21,387 | 17,266 | 17,603 | 18,536 | 21,298 |
| 2015 | 19,555 | 21,723 | 24,335 | 28,856 | 29,456 | 21,760 | 21,609 | 25,211 | 21,537 | 22,086 | 19,634 | 21,827 |
| 2016 | 18,574 | 19,825 | 21,480 | 20,607 | 21,252 | 19,582 | 21,882 | 15,273 | 15,261 | 19,664 | 21,600 | 27,195 |
| 2017 | 17,574 | 22,464 | 22,671 | 20,655 | 20,908 | 29,182 | 23,524 | 28,245 | 27,512 | 25,272 | 19,667 | 32,784 |
| 2018 | 26,405 | 24,053 | 31,940 | 24,656 | 24,656 | 24,656 | 24,636 | 27,716 | 25,663 | 33,172 | 31,896 | 33,172 |
| 2019 | 29,112 | 27,947 | 31,441 | 27,839 | 32,121 | 25,697 | 26,250 | 29,400 | 24,150 | 30,323 | 31,446 | 30,323 |
| 2020 | 23,858 | 30,887 | 18,708 | 9,144 | 20,319 | 21,335 | 23,660 | 21,031 | 22,784 | 26,741 | 21,966 | 30,561 |
| 2021 | 20,230 | 20,230 | 22,758 | 18,723 | 18,003 | 18,723 | 10,950 | 10,544 | 10,950 | 4,738 | 4,738 | 4,738 |
| 2022 | 17,932 | 17,932 | 20,173 | 20,726 | 19,958 | 19,958 | 15,352 | 15,942 | 15,352 | 16,249 | 15,599 | 16,899 |
| 2023 | 17,402 | 16,706 | 18,794 | 17,879 | 17,191 | 17,879 | 15,478 | 16,716 | 16,097 | 19,263 | 19,263 | 20,033 |
| 2024 | 17,824 | 17,824 | 18,537 | 16,971 | 17,650 | 17,650 | 12,193 | 13,657 | 11,218 | 18,933 | 22,226 | 23,049 |
| ∑ = 309,838 | ∑ = 357,877 | ∑ = 360,652 | ∑ = 336,220 | ∑ = 356,570 | ∑ = 356,777 | ∑ = 341,159 | ∑ = 350,110 | ∑ = 302,379 | ∑ = 324,636 | ∑ = 324,356 | ∑ = 384,808 |
US Annual Sales
US Annual Growth
Chevrolet Equinox Canada Sales Data & Charts
Canada Annual Sales