Mercedes-Benz GLC/GLK-Class
Here you will find monthly and yearly Canadian and U.S. sales figures for the Mercedes-Benz GLK. The Mercedes-Benz GLK was replaced by the Mercedes-Benz GLC in 2015 as Mercedes restructured its naming system.
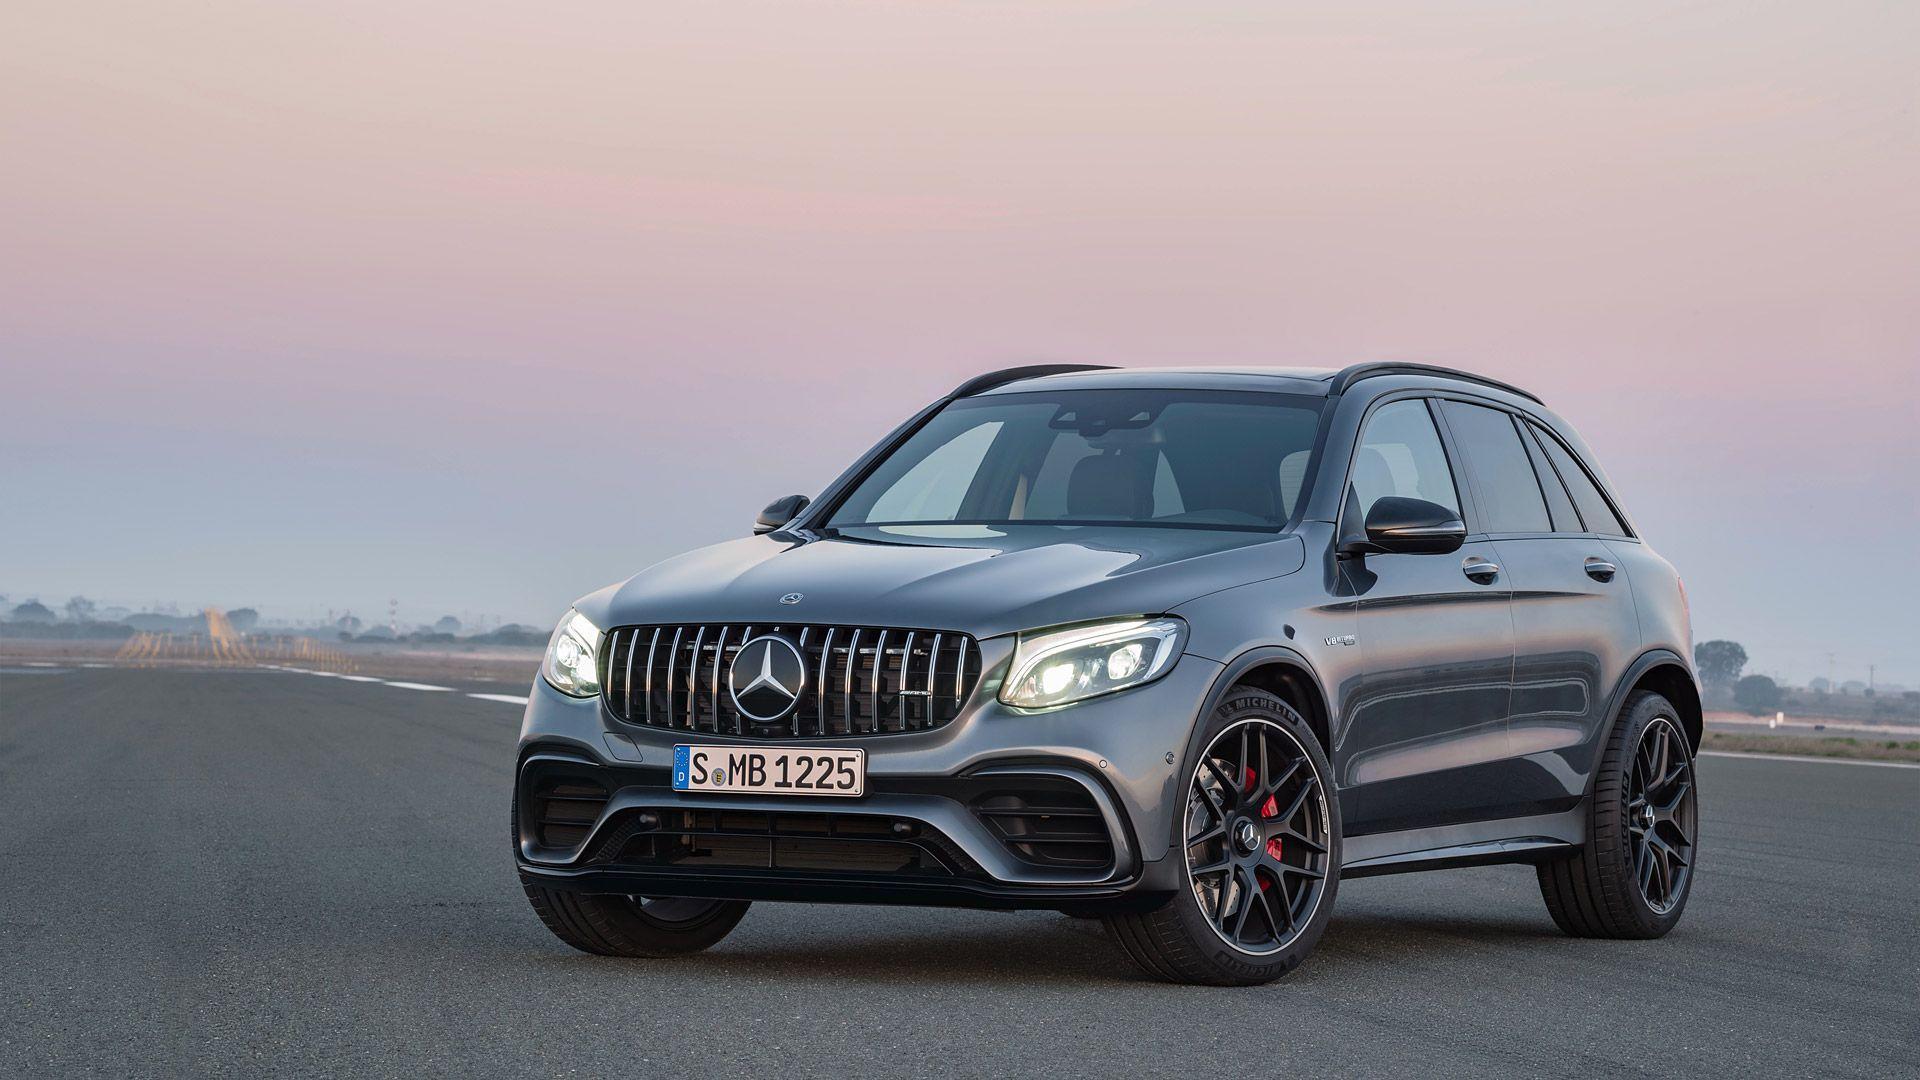
Mercedes-Benz GLC-Class Overview
The Mercedes-Benz GLC is a luxury mid-size SUV that has been in production since 2015. It is the smallest SUV in the Mercedes-Benz lineup and is positioned below the Mercedes-Benz GLE-Class. The GLC is available in two body styles: standard and coupe. The standard GLC is available in rear-wheel drive or all-wheel drive, while the coupe is only available in all-wheel drive. The GLC is powered by a variety of engines, including a 2.0L turbocharged inline-4, a 3.0L turbocharged inline-6, and a 2.0L turbocharged inline-4 hybrid.
The GLC is praised for its luxurious interior, comfortable ride, and handling. It is also praised for its fuel efficiency, with the GLC300 getting up to 24 mpg in the city and 33 mpg on the highway. However, the GLC has been criticized for its high price tag, which starts at $43,300. It has also been criticized for its lack of cargo space, with only 23 cubic feet of space behind the rear seats.
Mercedes-Benz GLC-Class U.S Sales Data & Charts
US Monthly Sales
| Year | Jan | Feb | Mar | Apr | May | Jun | Jul | Aug | Sep | Oct | Nov | Dec |
|---|---|---|---|---|---|---|---|---|---|---|---|---|
| 2009 | 1,300 | 1,918 | 2,598 | 1,869 | 1,759 | 1,539 | 1,809 | 1,665 | 1,558 | 1,833 | 1,724 | 2,372 |
| 2010 | 1,803 | 2,126 | 2,333 | 1,799 | 1,814 | 1,487 | 1,805 | 1,426 | 1,685 | 1,397 | 1,590 | 1,684 |
| 2011 | 1,625 | 1,853 | 1,963 | 1,927 | 2,214 | 1,930 | 1,628 | 1,933 | 1,934 | 2,494 | 2,463 | 2,346 |
| 2012 | 1,976 | 3,260 | 2,422 | 2,067 | 1,233 | 2,052 | 1,880 | 2,775 | 3,206 | 2,943 | 3,276 | 3,004 |
| 2013 | 2,396 | 2,420 | 2,694 | 2,702 | 2,728 | 2,806 | 2,780 | 2,372 | 2,387 | 2,695 | 3,344 | 3,229 |
| 2014 | 2,302 | 2,624 | 3,345 | 3,144 | 3,457 | 3,766 | 3,870 | 3,075 | 2,646 | 2,695 | 2,326 | 1,857 |
| 2015 | 1,398 | 1,781 | 2,478 | 3,071 | 2,558 | 2,549 | 2,318 | 2,168 | 2,056 | 1,941 | 1,216 | 4,366 |
| 2016 | 2,849 | 3,278 | 4,871 | 4,439 | 4,183 | 3,771 | 3,411 | 4,715 | 4,873 | 3,588 | 3,876 | 4,018 |
| 2017 | 3,065 | 2,765 | 3,126 | 3,305 | 3,737 | 3,729 | 4,002 | 4,498 | 4,662 | 4,245 | 5,357 | 6,152 |
| 2018 | 4,793 | 5,403 | 6,064 | 5,853 | 6,424 | 6,608 | 4,446 | 4,926 | 6,070 | 5,649 | 6,199 | 7,294 |
| 2019 | 4,908 | 4,176 | 6,282 | 5,378 | 5,378 | 6,568 | 5,539 | 6,336 | 6,840 | 7,083 | 7,515 | 6,436 |
| 2020 | 4,254 | 5,508 | 3,336 | 1,703 | 3,784 | 3,974 | 4,007 | 3,562 | 3,859 | 6,288 | 5,165 | 7,186 |
| 2021 | 4,982 | 4,982 | 5,605 | 4,923 | 4,734 | 4,923 | 2,694 | 2,594 | 2,694 | 4,558 | 4,558 | 4,558 |
| 2022 | 5,411 | 5,411 | 6,088 | 6,545 | 6,302 | 6,302 | 6,403 | 6,650 | 6,403 | 3,339 | 3,205 | 3,472 |
| 2023 | 1,200 | 1,152 | 1,296 | 4,812 | 4,627 | 4,812 | 3,687 | 3,982 | 3,835 | 3,568 | 3,568 | 3,711 |
| 2024 | 2,834 | 2,834 | 2,947 | 5,679 | 5,906 | 5,906 | 6,678 | 7,480 | 6,144 | 5,236 | 6,146 | 6,374 |
| ∑ = 47,096 | ∑ = 51,491 | ∑ = 57,448 | ∑ = 59,216 | ∑ = 60,838 | ∑ = 62,722 | ∑ = 56,957 | ∑ = 60,157 | ∑ = 60,852 | ∑ = 59,552 | ∑ = 61,528 | ∑ = 68,059 |