Mercedes-Benz GLE-Class
The Mercedes-Benz GLE-Class is a series of mid-size luxury SUVs produced by the German automaker Mercedes-Benz. The GLE nameplate was introduced in 2015, succeeding the previously named M-Class (or ML-Class), and it aligns with Mercedes’ nomenclature that associates the SUV with the corresponding E-Class sedan.
Mercedes-Benz GLE-Class Overview
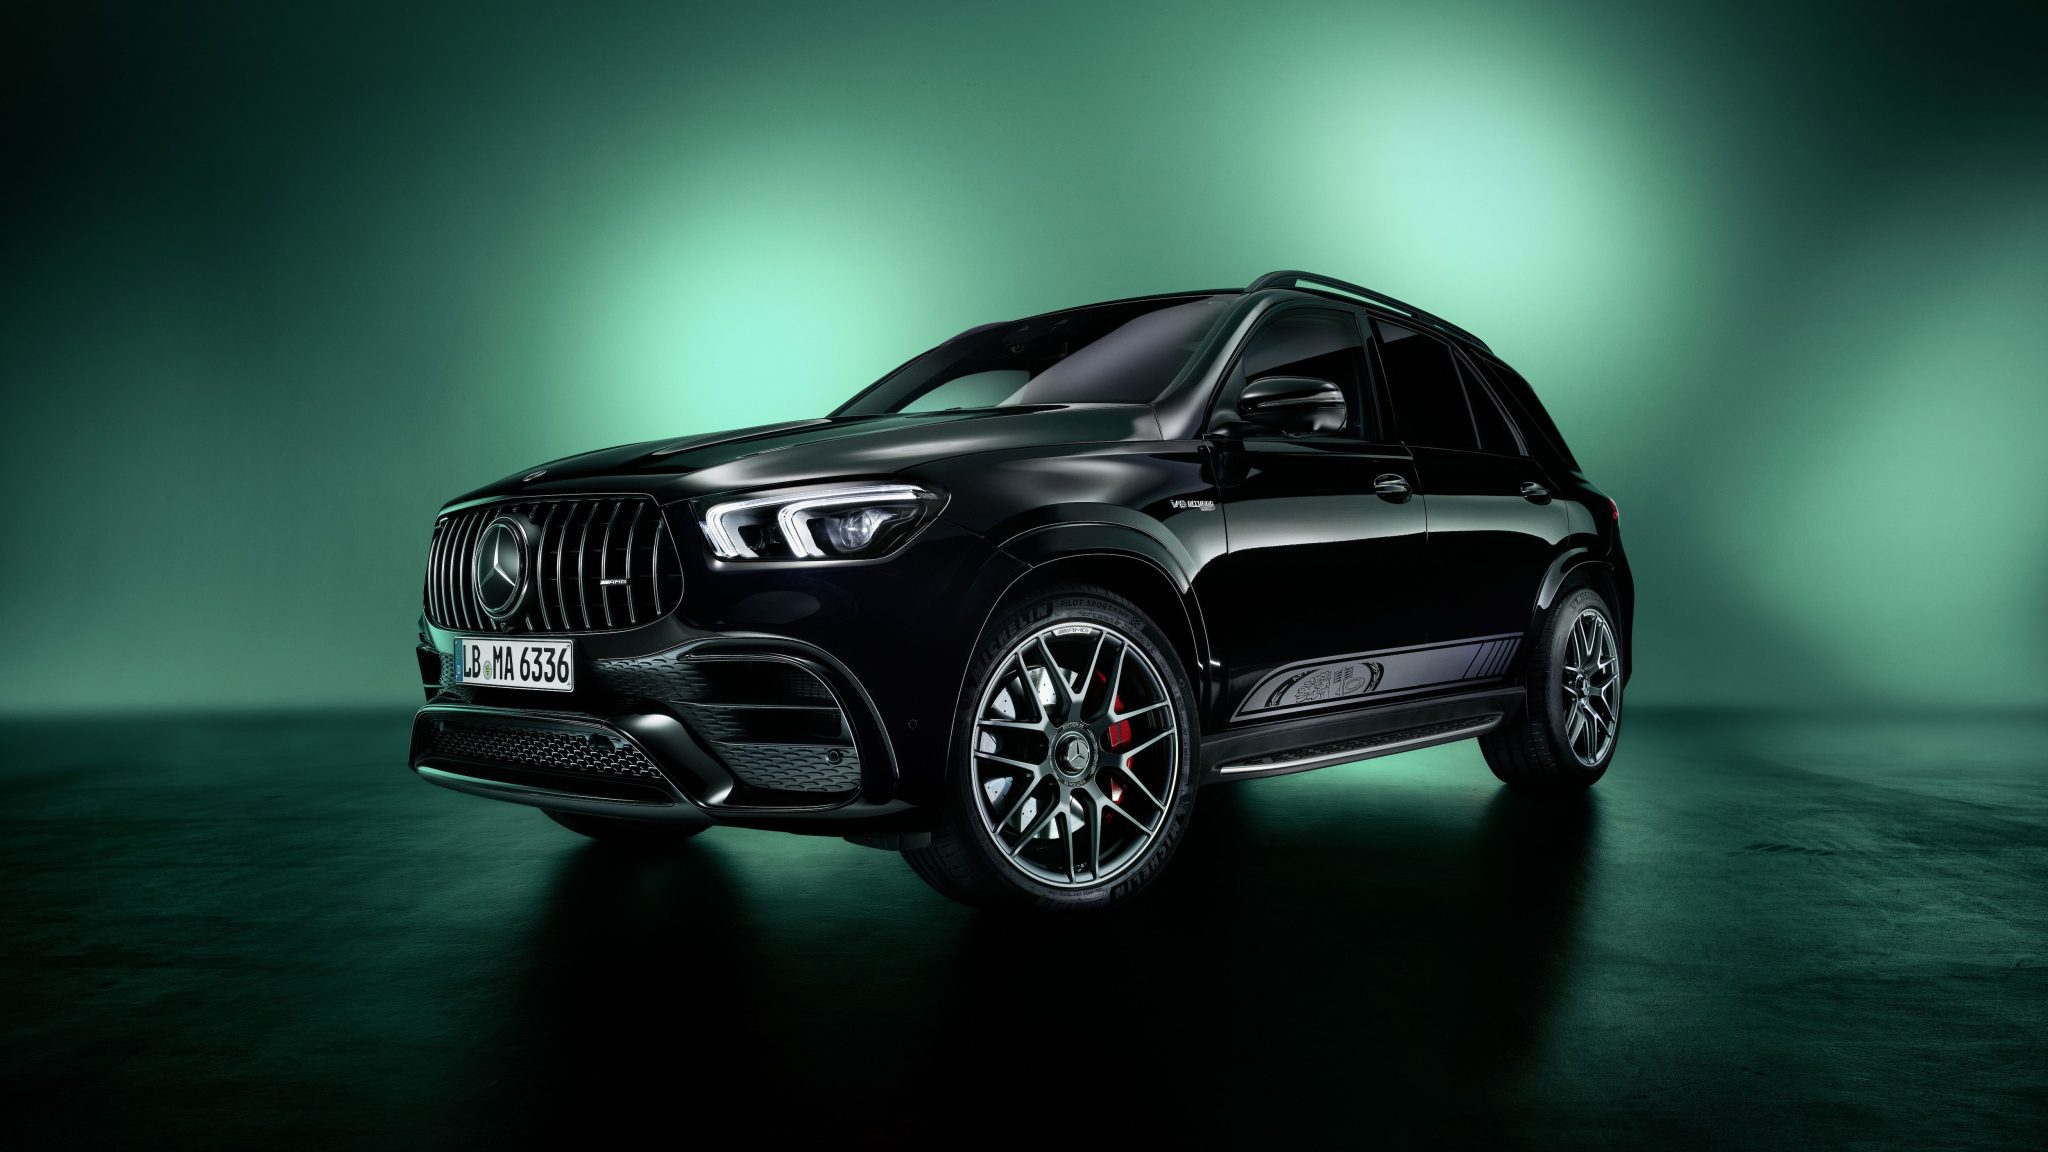
The Mercedes-Benz GLE-Class stands out as a versatile and luxurious mid-size SUV, offering a wide array of options to suit various preferences and needs. From its comfortable daily driving capability to its high-performance AMG versions, the GLE demonstrates a strong blend of style, luxury, technology, and performance.
The GLE is available in two body styles: standard and Coupe. The standard GLE is available in rear-wheel drive or all-wheel drive, while the coupe is only available in all-wheel drive. The GLE is powered by a variety of engines, including a 2.0L turbocharged inline-4, a 3.0L turbocharged inline-6, and a 4.0L twin-turbocharged V8. The GLE is praised for its luxurious interior, comfortable ride, and handling. It is also praised for its off-road capability, with the GLE450 4MATIC+ and GLE 580 4MATIC+ models having the optional Off-Road Engineering Package.
However, the GLE has been criticized for its high price tag, which starts at $56,800. It has also been criticized for its lack of cargo space, with only 27.6 cubic feet of space behind the rear seats. It is let down by its high price tag and its lack of cargo space, in what is a very competitive segment.
Mercedes-Benz GLE Sales Figures
Mercedes-Benz GLE-M-Class U.S Sales Data & Charts
US Monthly Sales
| Year | Jan | Feb | Mar | Apr | May | Jun | Jul | Aug | Sep | Oct | Nov | Dec |
|---|---|---|---|---|---|---|---|---|---|---|---|---|
| 2005 | 980 | 944 | 2,283 | 3,248 | 3,319 | 3,516 | 3,526 | 3,455 | 2,727 | 2,641 | 2,980 | 5,340 |
| 2006 | 1,962 | 2,155 | 2,740 | 2,590 | 2,278 | 2,601 | 2,446 | 2,312 | 2,706 | 2,770 | 3,183 | 3,889 |
| 2007 | 2,351 | 2,431 | 2,619 | 2,382 | 2,601 | 2,551 | 3,015 | 3,062 | 2,948 | 2,942 | 3,015 | 3,962 |
| 2008 | 3,237 | 3,081 | 3,189 | 2,582 | 2,706 | 2,601 | 2,691 | 2,430 | 2,981 | 3,150 | 2,911 | 2,761 |
| 2009 | 1,355 | 1,353 | 1,675 | 1,838 | 2,021 | 2,362 | 1,674 | 2,577 | 2,552 | 2,370 | 2,679 | 3,343 |
| 2010 | 1,927 | 1,655 | 2,154 | 2,269 | 2,264 | 2,124 | 1,973 | 2,473 | 2,780 | 2,826 | 3,470 | 3,783 |
| 2011 | 2,484 | 1,924 | 2,792 | 1,990 | 1,928 | 3,071 | 2,778 | 2,191 | 2,477 | 4,091 | 4,796 | 5,313 |
| 2012 | 4,002 | 6,816 | 4,070 | 3,057 | 3,198 | 2,891 | 1,790 | 2,243 | 2,439 | 2,868 | 3,894 | 4,241 |
| 2013 | 2,928 | 2,733 | 3,501 | 3,280 | 3,219 | 3,651 | 3,092 | 3,816 | 3,180 | 3,113 | 4,328 | 4,485 |
| 2014 | 2,824 | 3,258 | 4,052 | 3,831 | 4,084 | 3,891 | 3,276 | 3,438 | 3,460 | 3,113 | 5,190 | 5,625 |
| 2015 | 3,144 | 3,316 | 4,023 | 4,945 | 3,991 | 3,541 | 3,851 | 1,802 | 3,492 | 4,176 | 4,883 | 6,310 |
| 2016 | 3,515 | 3,948 | 4,730 | 4,327 | 4,003 | 4,515 | 4,412 | 3,756 | 4,127 | 4,042 | 4,694 | 5,574 |
| 2017 | 3,970 | 4,017 | 4,919 | 4,468 | 4,631 | 4,824 | 3,879 | 3,750 | 4,583 | 4,817 | 4,914 | 5,823 |
| 2018 | 3,488 | 3,595 | 4,573 | 4,110 | 3,657 | 3,318 | 4,447 | 3,622 | 3,807 | 3,671 | 3,988 | 3,734 |
| 2019 | 2,142 | 2,197 | 2,196 | 2,566 | 2,566 | 4,843 | 5,301 | 5,370 | 4,862 | 4,782 | 6,052 | 5,787 |
| 2020 | 3,833 | 4,963 | 3,006 | 1,710 | 3,800 | 3,990 | 3,807 | 3,384 | 3,666 | 5,396 | 4,432 | 6,166 |
| 2021 | 5,334 | 5,334 | 6,000 | 6,428 | 6,181 | 6,428 | 4,007 | 3,858 | 4,007 | 5,832 | 5,832 | 5,832 |
| 2022 | 5,117 | 0 | 5,756 | 5,625 | 5,417 | 5,417 | 4,542 | 4,717 | 4,542 | 5,600 | 5,376 | 5,824 |
| 2023 | 5,234 | 5,024 | 5,652 | 4,650 | 4,471 | 4,650 | 4,317 | 1,835 | 4,489 | 4,785 | 4,785 | 4,677 |
| 2024 | 4,966 | 4,966 | 5,164 | 5,123 | 5,328 | 5,328 | 5,024 | 5,627 | 4,622 | 6,422 | 7,539 | 7,818 |
| ∑ = 64,793 | ∑ = 63,710 | ∑ = 75,094 | ∑ = 71,019 | ∑ = 71,663 | ∑ = 76,113 | ∑ = 69,848 | ∑ = 65,718 | ∑ = 70,447 | ∑ = 79,407 | ∑ = 88,941 | ∑ = 100,287 |