Subaru BRZ
Here you will find monthly and yearly Canadian, European and U.S. sales figures for the Subaru BRZ. The Subaru BRZ is a compact sports coupe developed in a unique collaboration between Subaru and Toyota. Launched in 2012, this rear-wheel-drive vehicle is known for its lightweight construction, balanced handling, and affordable price tag. Toyota’s version of this collaboration is sold as the Toyota 86 (previously known as the Scion FR-S in North America before the Scion brand was discontinued).
Subaru BRZ Overview
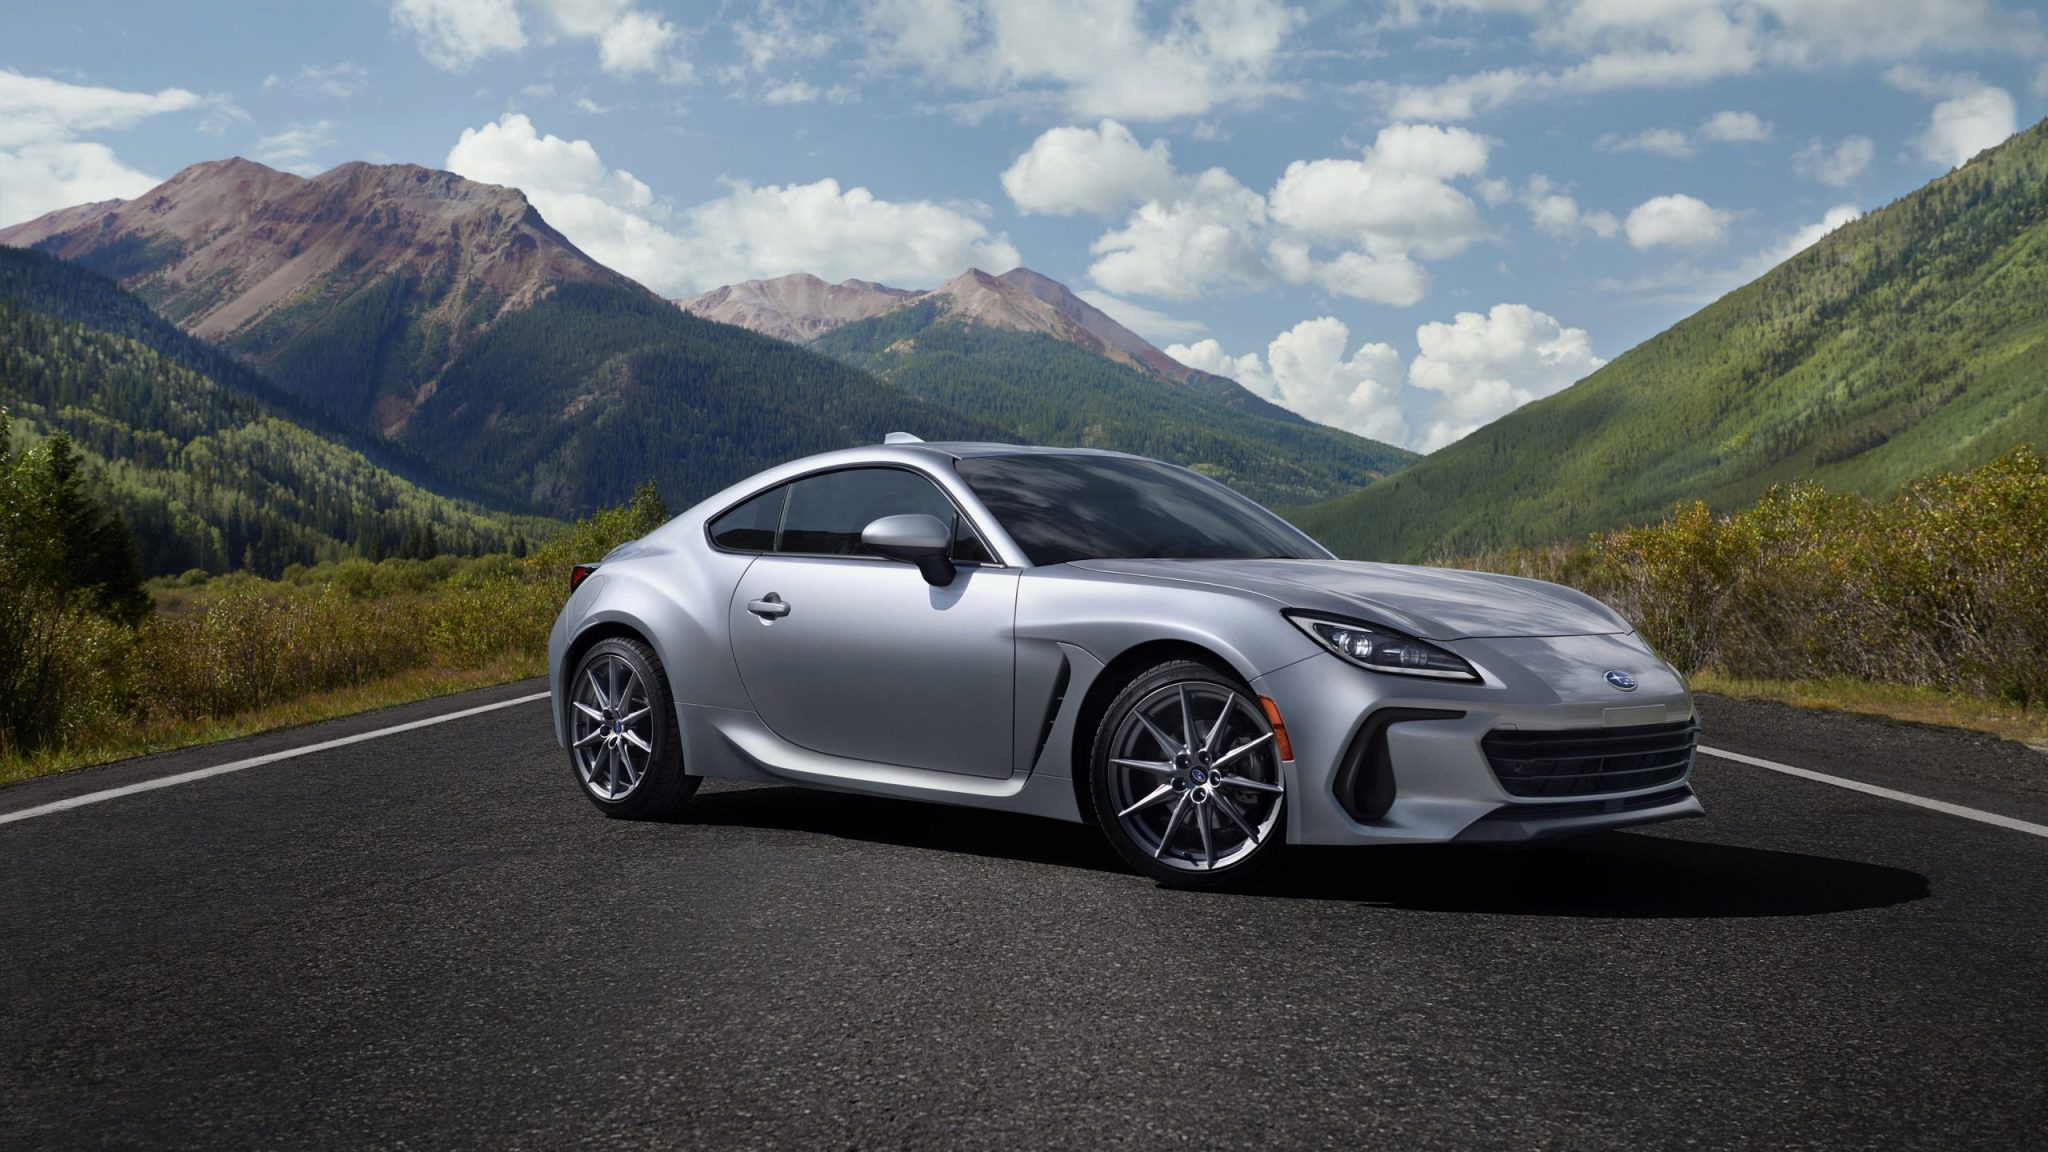
The BRZ was developed as a joint venture between Subaru and Toyota. The name “BRZ” stands for “Boxer engine”, “Rear-wheel drive”, and “Zenith”. The car was aimed at purists looking for an affordable, lightweight sports car with a focus on handling rather than sheer power.
The BRZ is powered by a naturally aspirated 2.0-liter flat-four (boxer) engine developed by Subaru, producing around 200 horsepower in its initial iteration. This engine is characterized by its low center of gravity, which contributes to the car’s handling prowess. The car comes with a choice of a six-speed manual or a six-speed automatic transmission. BRZ produces 228 horsepower and 184 lb-ft of torque and with rear-wheel drive and a 50/50 weight distribution, it has excellent handling and makes it a fun car to drive on winding roads. The BRZ is available in two trim levels: Premium and Limited. The Premium trim comes standard with features like a 7-inch touchscreen infotainment system, Bluetooth, and a rearview camera. The Limited trim adds features like a 8-speaker sound system, leather seats, and a sunroof.
The BRZ has been praised for its handling, performance, and affordability. It has also been awarded several awards, including the 2013 Motor Trend Car of the Year. The BRZ (and its Toyota counterpart) has been generally well-received by automotive enthusiasts and critics alike. It is often praised for its driving dynamics, lightweight nature, and affordable entry into the sports car world. Some critics and fans have expressed a desire for a more powerful, turbocharged variant, but others appreciate the car’s focus on balance and handling over sheer power.
Subaru BRZ Sales Figures
The Subaru BRZ, along with the Toyota 86, has carved out a niche for itself in the market, appealing to driving enthusiasts looking for a modern, affordable, rear-wheel-drive sports car. Its unique offering in the market, combined with its engaging driving experience, has earned it a loyal following.
Subaru BRZ U.S Sales Data & Charts
US Monthly Sales
| Year | Jan | Feb | Mar | Apr | May | Jun | Jul | Aug | Sep | Oct | Nov | Dec |
|---|---|---|---|---|---|---|---|---|---|---|---|---|
| 2012 | 0 | 0 | 0 | 0 | 271 | 818 | 498 | 623 | 508 | 402 | 527 | 497 |
| 2013 | 463 | 420 | 905 | 812 | 679 | 789 | 706 | 868 | 704 | 780 | 756 | 705 |
| 2014 | 592 | 617 | 857 | 820 | 852 | 557 | 724 | 720 | 506 | 435 | 408 | 416 |
| 2015 | 330 | 334 | 495 | 494 | 606 | 550 | 525 | 498 | 301 | 374 | 376 | 413 |
| 2016 | 361 | 425 | 425 | 466 | 383 | 347 | 353 | 302 | 300 | 330 | 235 | 214 |
| 2017 | 204 | 344 | 439 | 444 | 437 | 429 | 372 | 337 | 301 | 271 | 256 | 297 |
| 2018 | 235 | 270 | 369 | 412 | 364 | 316 | 297 | 383 | 284 | 254 | 301 | 349 |
| 2019 | 259 | 242 | 318 | 287 | 231 | 203 | 167 | 158 | 111 | 112 | 115 | 131 |
| 2020 | 112 | 166 | 114 | 105 | 227 | 238 | 266 | 267 | 251 | 221 | 129 | 171 |
| 2021 | 163 | 179 | 241 | 118 | 19 | 1 | 0 | 0 | 1 | 24 | 505 | 1,069 |
| 2022 | 331 | 349 | 291 | 298 | 201 | 193 | 228 | 308 | 231 | 278 | 312 | 325 |
| 2023 | 332 | 368 | 285 | 507 | 638 | 382 | 311 | 268 | 270 | 291 | 263 | 273 |
| 2024 | 250 | 243 | 273 | 178 | 227 | 243 | 271 | 347 | 291 | 365 | 320 | 337 |
| 2025 | 224 | 244 | 334 | 0 | 0 | 0 | 0 | 0 | 0 | 0 | 0 | 0 |
| ∑ = 3,856 | ∑ = 4,201 | ∑ = 5,346 | ∑ = 4,941 | ∑ = 5,135 | ∑ = 5,066 | ∑ = 4,718 | ∑ = 5,079 | ∑ = 4,059 | ∑ = 4,137 | ∑ = 4,503 | ∑ = 5,197 |