Pontiac Sales Data, Trends & Analysis for the U.S Automotive Market
This is your hub for all of the Pontiac sales data for the U.S market. A lot of people will tell you now that the Pontiac line was arguably the best vehicles that GM has ever offered. This is really a prestigious honor, especially if you think about the number of wholesale vehicles that GM has produced for decades.
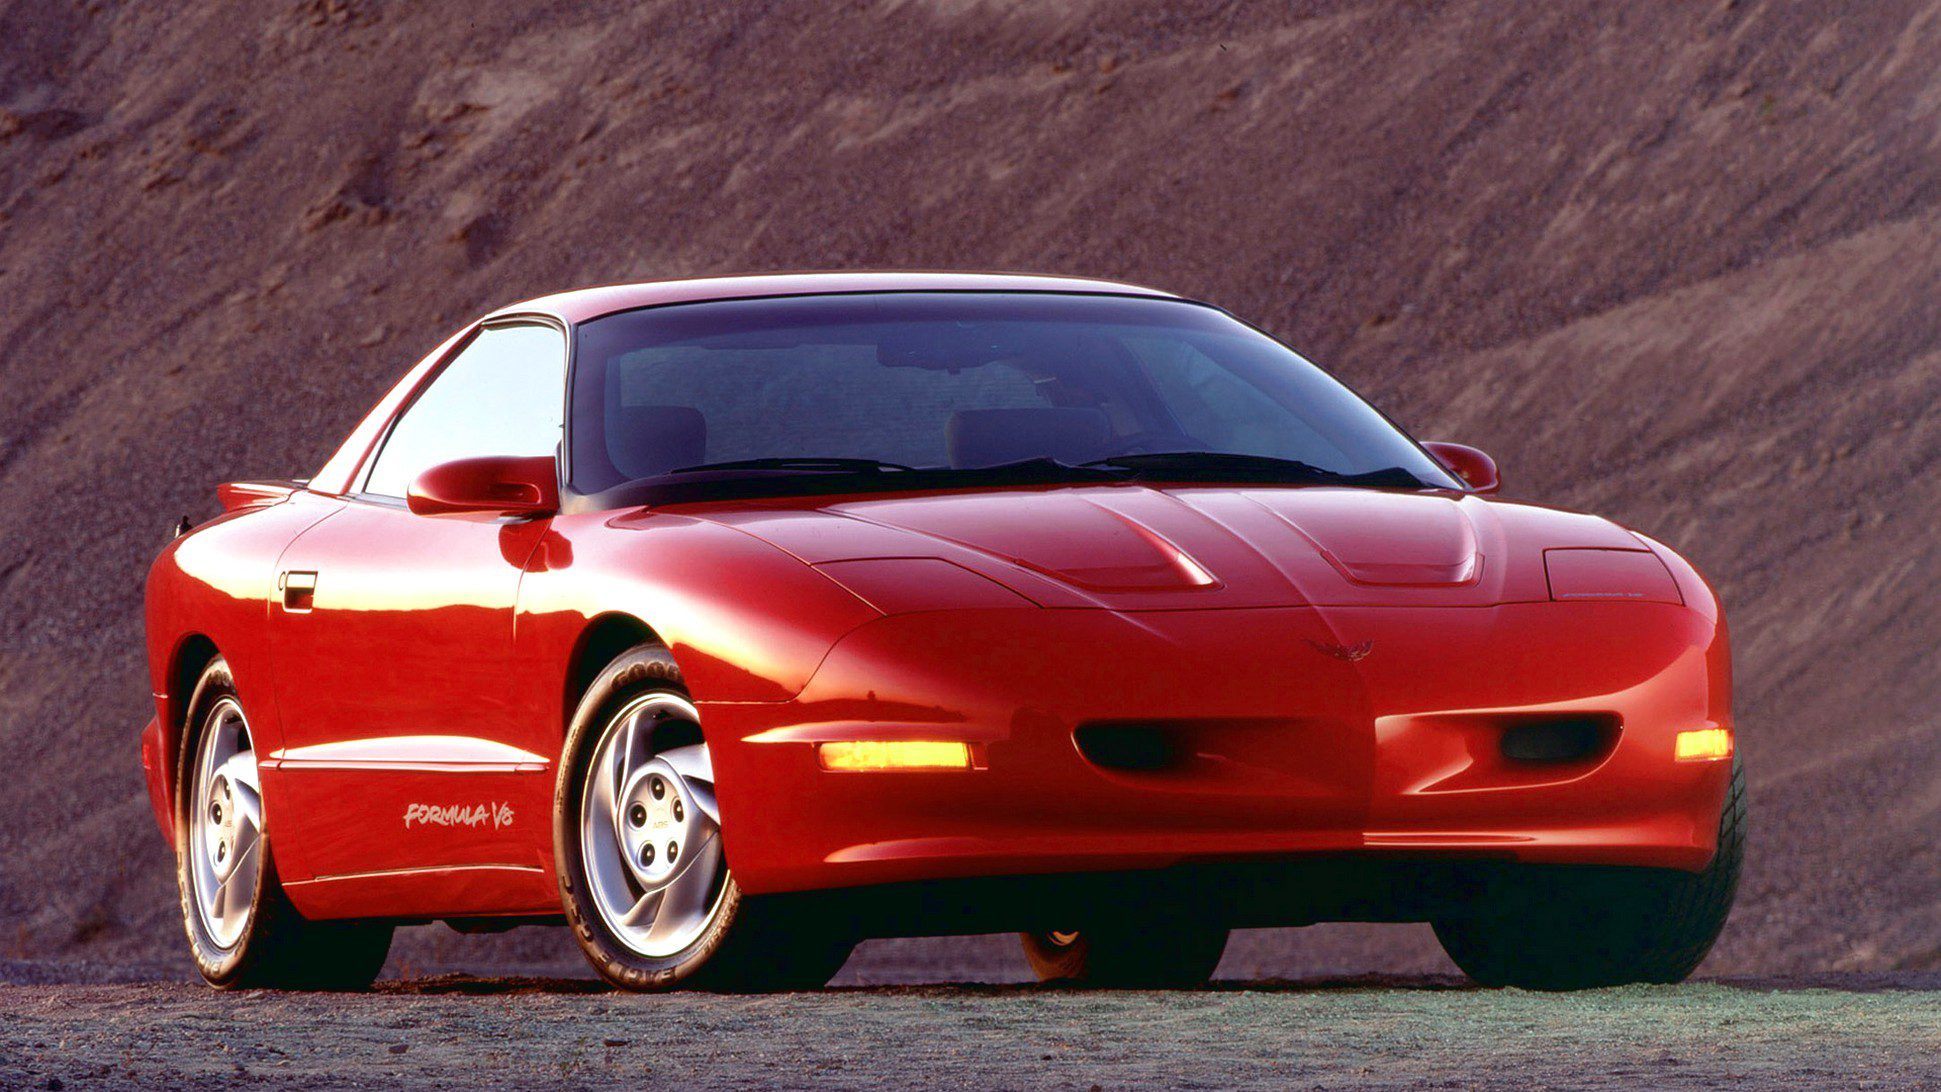
The Pontiac brand is most famous for their muscle cars. The Firebird and the Trans Am are just two of the most popular muscle cars. Even though the two cars were very similar to the Chevy Camaro, Pontiac was able to differentiate the cars by adding some great elements such as the lower price of the Firebird which appealed to many buyers and the bird on the front of the Trans Am which made it more unique.
If you go back even further in time, you will find that the Pontiac is considered to be a pioneer. The Pontiac GTO which was produced from 1964–1974, was considered by many as the car that started the muscle car trend. It is still very popular these days and continues to be one of those vehicles that set the bar high for the future of all muscle cars. Pontiac also established itself as a leader in the market when it came to the top-selling vehicles in the US.
If you take a close look at the various cars produced by Pontiac, you’ll find that they always have something to offer for every era. They have always been one of the leaders in the market, especially when it comes to design and performance. So, why did Pontiac ceased to exist today?
Well, as you can see from the table below, Pontiac saw its sales continuously dropped every year since the start of the 2000s. Profitability killed the Pontiac brand. In the 2000s, the US car market was flooded with a number of really cheap cars from different automakers. Pontiac was unable to compete against other car manufacturers and brands that offered less expensive products. In 2009, the Pontiac line was discontinued after more than 80 years of activity in the auto industry.
Pontiac Annual Sales, Growth and Market Share in the U.S
| Year | Sales | YOY Change | Marketshare | Marketshare Change |
|---|---|---|---|---|
| 1987 | 35,564 | 0.00 | 0.98 | 0.00 |
| 1988 | 64,037 | 80.06 | 1.66 | 41.25 |
| 1989 | 44,641 | -30.29 | 1.28 | -29.61 |
| 1990 | 39,081 | -12.45 | 1.30 | 1.36 |
| 1991 | 34,700 | -11.21 | 1.27 | -2.55 |
| 1992 | 13,360 | -61.50 | 0.51 | -146.07 |
| 1993 | 7,700 | -42.37 | 0.28 | -83.89 |
| 1994 | 0 | -100.00 | 0.00 | 0.00 |
| 1995 | 0 | 0.00 | 0.00 | 0.00 |
| 1996 | 0 | 0.00 | 0.00 | 0.00 |
| 1997 | 0 | 0.00 | 0.00 | 0.00 |
| 1998 | 0 | 0.00 | 0.00 | 0.00 |
| 1999 | 0 | 0.00 | 0.00 | 0.00 |
| 2000 | 0 | 0.00 | 0.00 | 0.00 |
| 2001 | 0 | 0.00 | 0.00 | 0.00 |
| 2002 | 0 | 0.00 | 0.00 | 0.00 |
| 2003 | 0 | 0.00 | 0.00 | 0.00 |
| 2004 | 0 | 0.00 | 0.00 | 0.00 |
| 2005 | 438,106 | 0.00 | 2.56 | 100.00 |
| 2006 | 410,229 | -6.36 | 2.46 | -3.99 |
| 2007 | 358,025 | -12.73 | 2.21 | -11.53 |
| 2008 | 267,357 | -25.32 | 2.00 | -10.05 |
| 2009 | 178,300 | -33.31 | 1.70 | -18.18 |
| 2010 | 1,182 | -99.34 | 0.01 | -16,725.20 |
| 2011 | 0 | -100.00 | 0.00 | 0.00 |
| 2012 | 0 | 0.00 | 0.00 | 0.00 |
| 2013 | 0 | 0.00 | 0.00 | 0.00 |
| 2014 | 0 | 0.00 | 0.00 | 0.00 |
| 2015 | 0 | 0.00 | 0.00 | 0.00 |
| 2016 | 0 | 0.00 | 0.00 | 0.00 |
| 2017 | 0 | 0.00 | 0.00 | 0.00 |
| 2018 | 0 | 0.00 | 0.00 | 0.00 |
| 2019 | 0 | 0.00 | 0.00 | 0.00 |
| 2020 | 0 | 0.00 | 0.00 | 0.00 |
| 2021 | 0 | 0.00 | 0.00 | 0.00 |
| 2022 | 0 | 0.00 | 0.00 | 0.00 |
| 2023 | 0 | 0.00 | 0.00 | 0.00 |
| 2024 | 0 | 0.00 | 0.00 | 0.00 |
Pontiac U.S Annual Sales Units & Growth Chart
Pontiac U.S Growth Rate & Market Share Chart
Source: Automakers & ANDC


