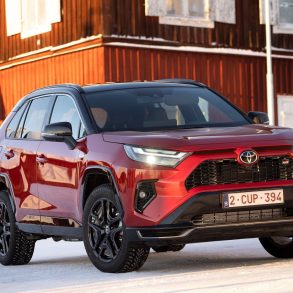
Toyota RAV4
Here you will find monthly and yearly Canadian, European, Chinese and U.S. sales figures for the Toyota RAV4. The Toyota RAV4 is a compact crossover SUV that has been a cornerstone of Toyota’s lineup since its introduction in 1994. Known for its reliability, versatility, and efficiency, the RAV4 has been one of the best-selling vehicles in its class for many years.
The Toyota RAV4’s blend of practicality, efficiency, safety, and value has made it a popular choice among a wide range of buyers. Whether used as a family vehicle, a commuter car, or for outdoor adventures, the RAV4 offers a compelling package that meets many different needs. As with any vehicle, specifics can change with each model year, so it’s wise to consult the latest information from Toyota or other reliable sources if you’re looking at a particular year or trim level.
Toyota RAV4 Overview
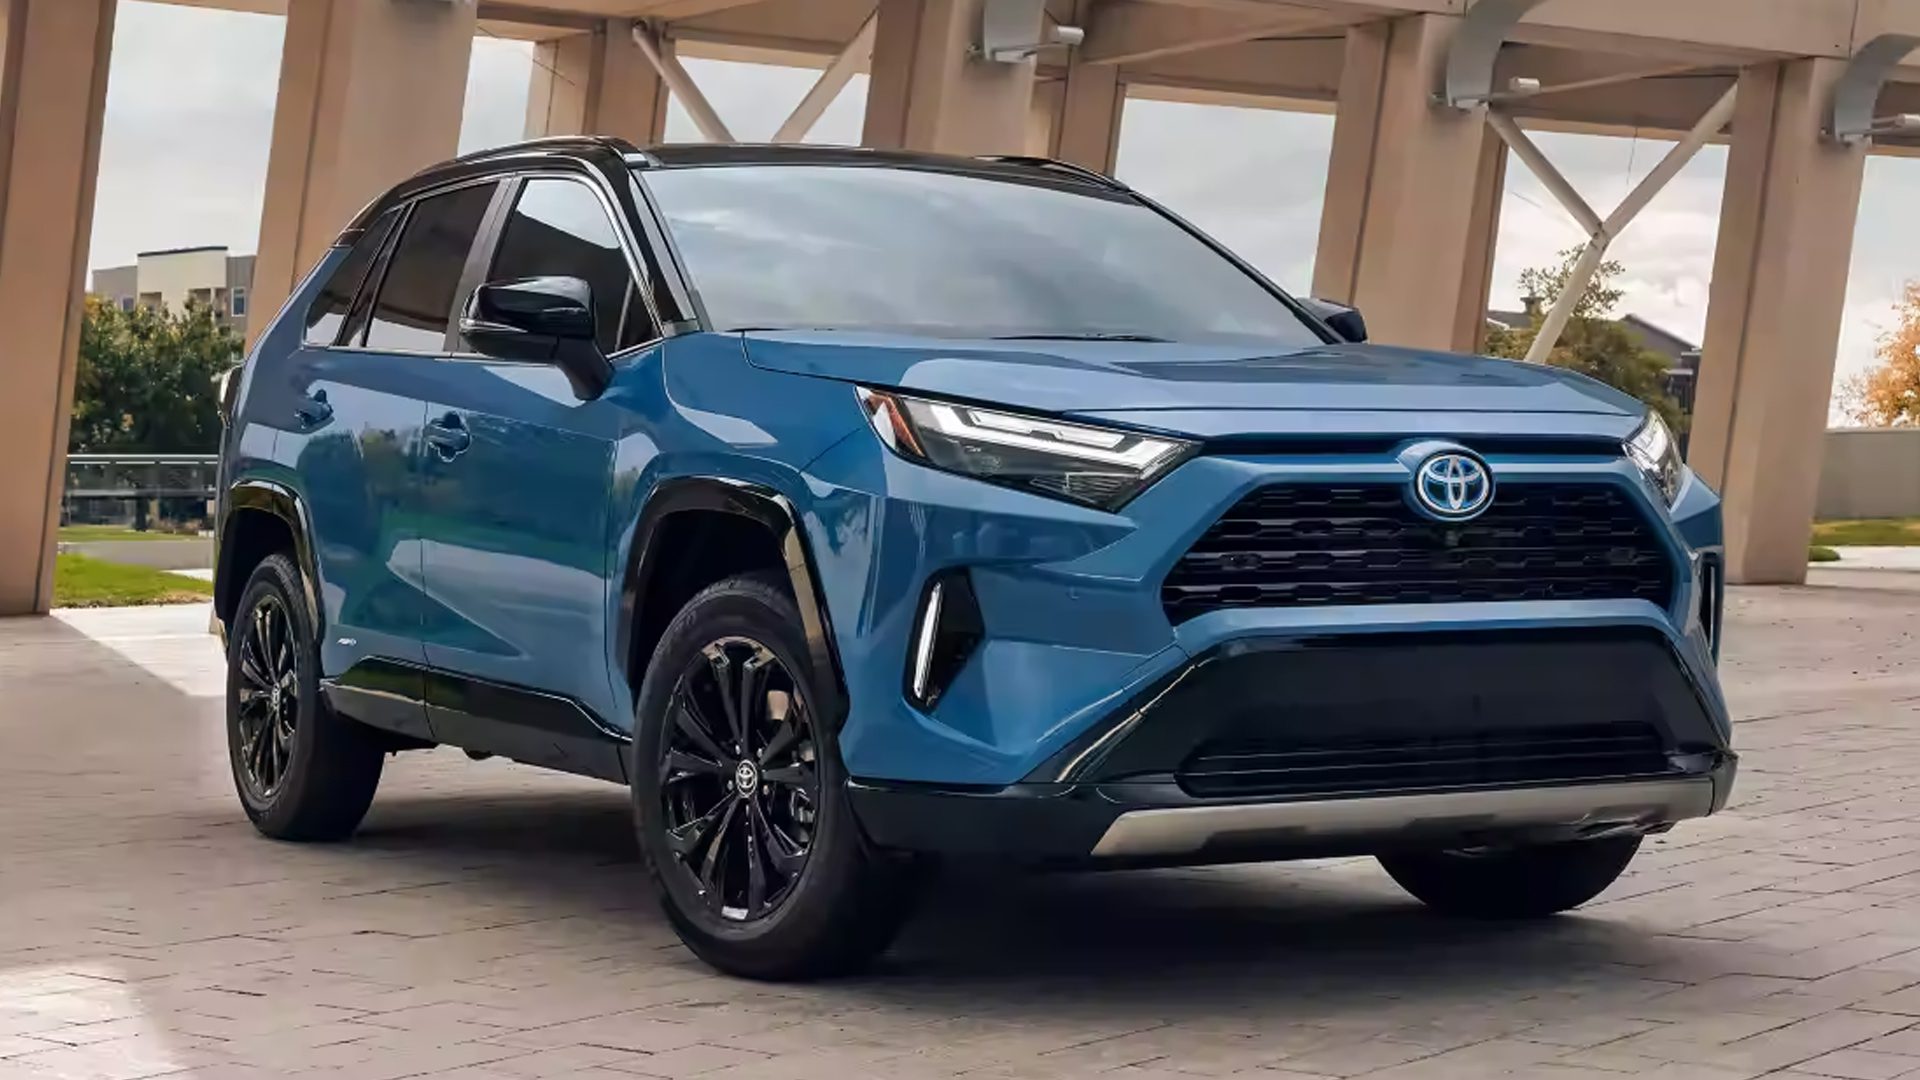
The Toyota RAV4 is a compact crossover SUV that has been in production since 1994. It is known for its fuel efficiency, reliability, and spacious interior. The RAV4 is available in four main configurations: LE, XLE, XSE, and TRD Off-Road. The LE is the base trim and comes standard with features such as a 7-inch touchscreen infotainment system, a rearview camera, Bluetooth, and a six-speaker sound system.
The XLE trim adds features such as a power liftgate, a JBL sound system, and heated front seats. The XSE trim adds features such as a panoramic sunroof, a JBL sound system with 11 speakers, and a sport-tuned suspension. The TRD Off-Road trim adds features such as a sport-tuned suspension, a locking rear differential, and all-terrain tires.
All RAV4s are powered by a 2.5L four-cylinder engine that produces 203 horsepower and 184 lb-ft of torque. It is mated to an eight-speed automatic transmission. The RAV4 gets an EPA-estimated 26 mpg in the city and 35 mpg on the highway.
The RAV4 has a spacious interior for its size and can seat up to five passengers. It has a cargo capacity of 37.5 cubic feet behind the rear seats and 73.4 cubic feet with the rear seats folded down. The RAV4 is a good car for those looking for a fuel-efficient, reliable, and spacious compact crossover SUV. It is not as powerful as some competitors, but it is more affordable.
Toyota RAV4 Sales Figures
Toyota RAV4 U.S Sales Data & Charts
US Monthly Sales
| Year | Jan | Feb | Mar | Apr | May | Jun | Jul | Aug | Sep | Oct | Nov | Dec |
|---|---|---|---|---|---|---|---|---|---|---|---|---|
| No data available in table | ||||||||||||
| ∑ = | ∑ = | ∑ = | ∑ = | ∑ = | ∑ = | ∑ = | ∑ = | ∑ = | ∑ = | ∑ = | ∑ = | |
US Annual Sales
US Annual Growth
Toyota RAV4 Canada Sales Data & Charts
Canada Annual Sales
Canada Annual Growth
Toyota RAV4 Europe Sales Data & Charts
Europe Annual Sales
Europe Annual Growth
Toyota RAV4 China Sales Data & Charts
Sales figures for the Toyota RAV4 in China. Toyota also sells a cloned version of the RAV4 with a slightly different front-end design in China, under the name Toyota Wildlander. This is a result of Toyota having two different Joint Ventures in China, and each of its partners wants the same opportunities for success. Since FAW-Toyota is already very successful with the RAV4, GAC-Toyota demanded their own version. Toyota already has a similar strategy with the C-HR and Izoa in China. Honda and VW are also famous for using a similar strategy of competing models within their brands in China.
Car sales statistics from China only include domestic production and exclude imported models.