Infiniti Q60
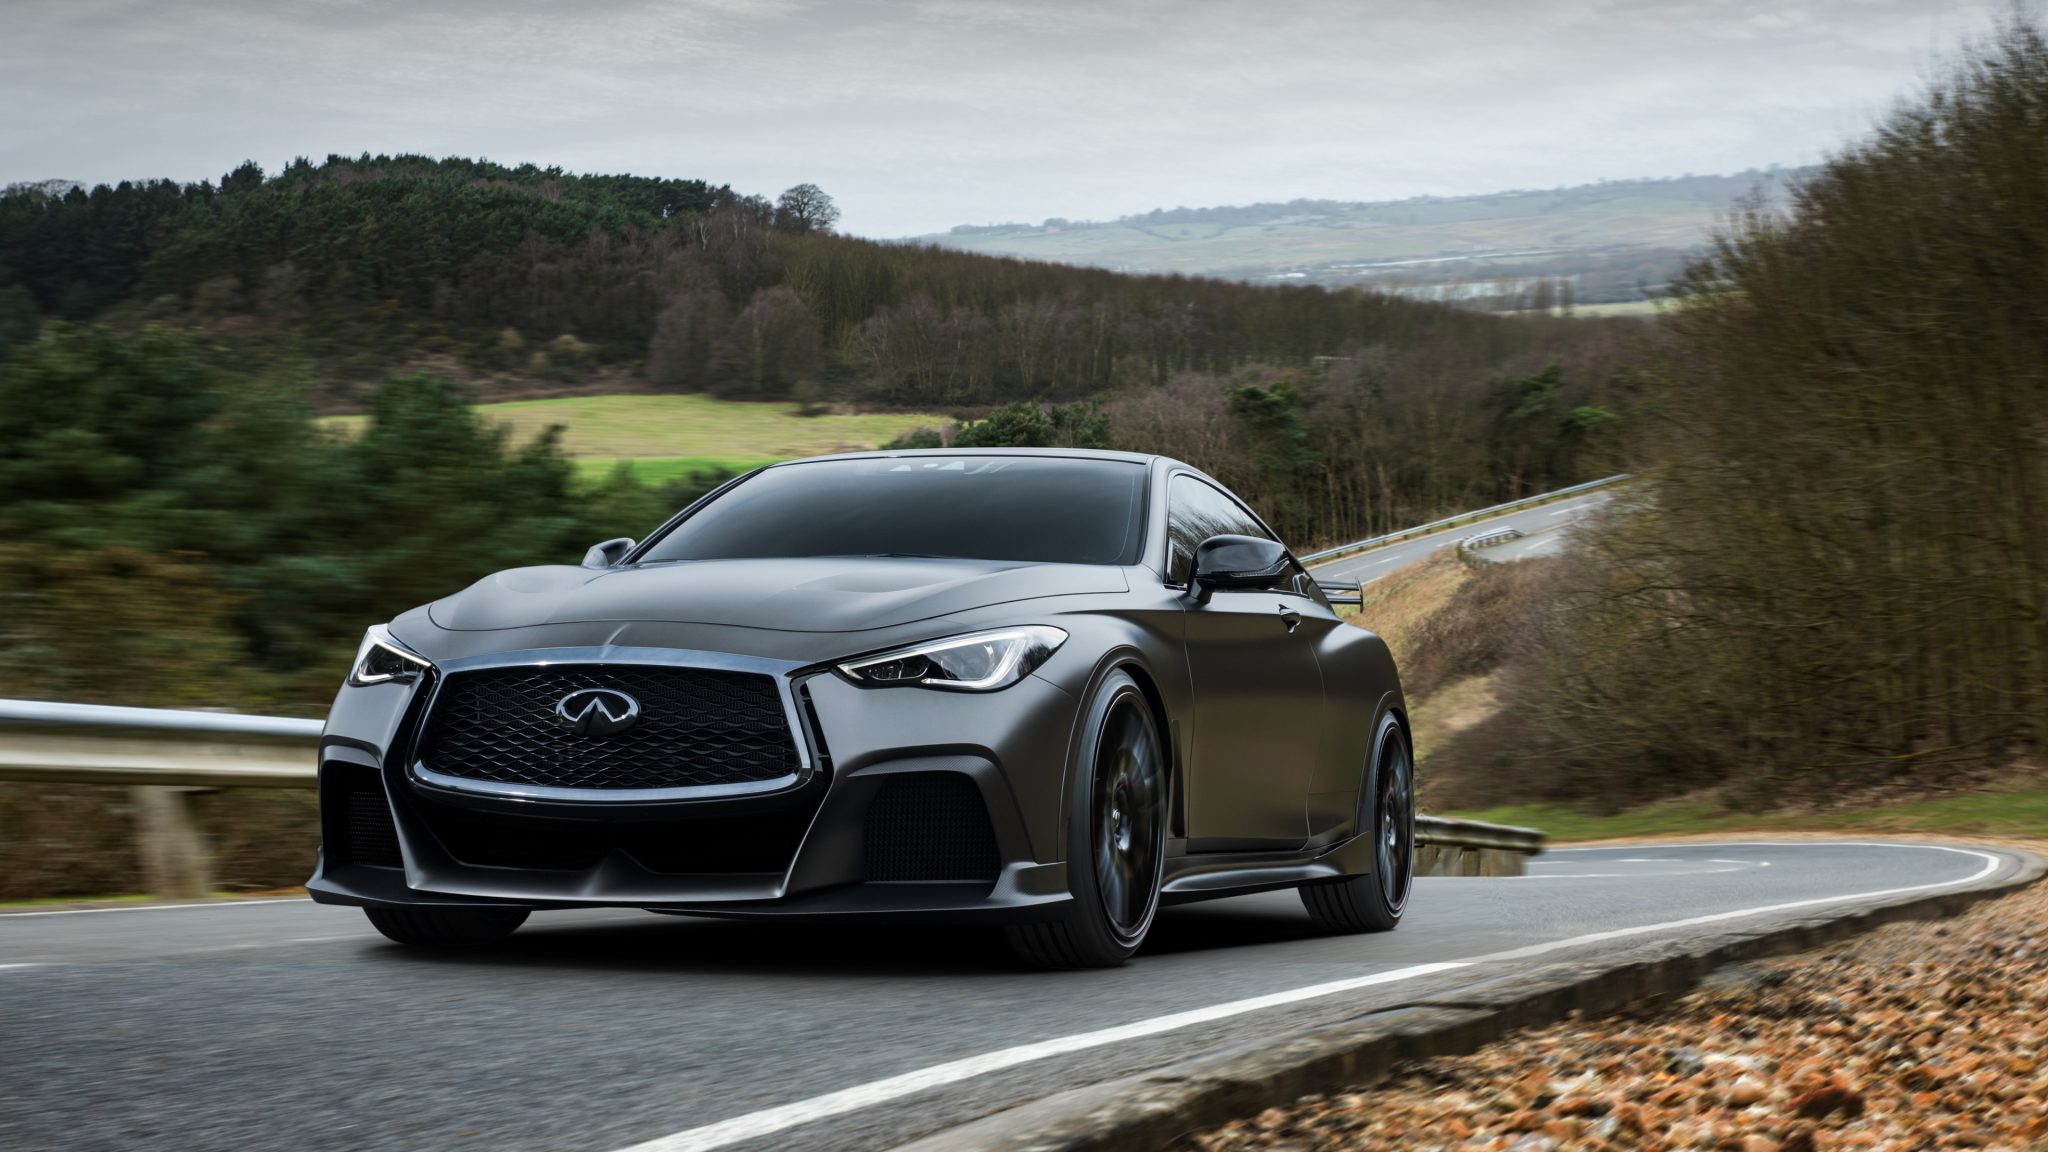
The Infiniti Q60 is a luxury sports coupe that was introduced in 2016. It is available in two main trims: the Q60 Pure and the Q60 Red Sport 400. The Q60 Pure is powered by a 3.7L V6 engine that produces 300 horsepower and 269 lb-ft of torque, while the Q60 Red Sport 400 is powered by a 3.0L twin-turbocharged V6 engine that produces 400 horsepower and 350 lb-ft of torque. Both models are available with rear-wheel drive or all-wheel drive. The Q60 is known for its sleek design, powerful engines, and agile handling. It is a popular choice for people who are looking for a luxury sports car that is fun to drive. In 2023, Infiniti will introduce a new version of the Q60, called the Q60 Monograph. The Monograph will have a more aggressive design and will be powered by a hybrid powertrain.
Infiniti Q60 Sales Figures
Overall, the Infiniti Q60 is a good choice for people who are looking for a luxury sports car that is fun to drive. It is not as fuel-efficient or as spacious as some other luxury sports cars, but it is still a good value for the price. It is a decent seller but isn’t a marketshare leader.
Infiniti Q60 U.S Sales Data & Charts
US Monthly Sales
| Year | Jan | Feb | Mar | Apr | May | Jun | Jul | Aug | Sep | Oct | Nov | Dec |
|---|---|---|---|---|---|---|---|---|---|---|---|---|
| 2018 | 0 | 855 | 1,136 | 650 | 848 | 591 | 755 | 674 | 835 | 809 | 590 | 662 |
| 2019 | 406 | 327 | 571 | 425 | 314 | 359 | 396 | 384 | 336 | 595 | 500 | 430 |
| 2020 | 301 | 390 | 236 | 139 | 308 | 323 | 207 | 184 | 199 | 171 | 140 | 195 |
| 2021 | 220 | 220 | 247 | 284 | 273 | 284 | 228 | 220 | 228 | 175 | 175 | 175 |
| 2022 | 246 | 246 | 276 | 217 | 209 | 209 | 78 | 81 | 78 | 69 | 66 | 71 |
| 2023 | 123 | 118 | 133 | 118 | 113 | 118 | 689 | 74 | 71 | 41 | 41 | 42 |
| 2024 | 12 | 12 | 13 | 4 | 4 | 4 | 1 | 1 | 1 | 1 | 0 | 0 |
| ∑ = 1,308 | ∑ = 2,168 | ∑ = 2,612 | ∑ = 1,837 | ∑ = 2,069 | ∑ = 1,888 | ∑ = 2,354 | ∑ = 1,618 | ∑ = 1,748 | ∑ = 1,861 | ∑ = 1,512 | ∑ = 1,575 |