Toyota Venza
Here you will find monthly and yearly Canadian, Chinese and U.S. sales figures for the Toyota Venza. The Toyota Venza is a mid-size crossover SUV that blends characteristics of traditional SUVs with those of passenger cars. First introduced in 2008, the Venza was initially produced until 2015 before being reintroduced as an all-new model for the 2021 model year.
Toyota Venza Overview
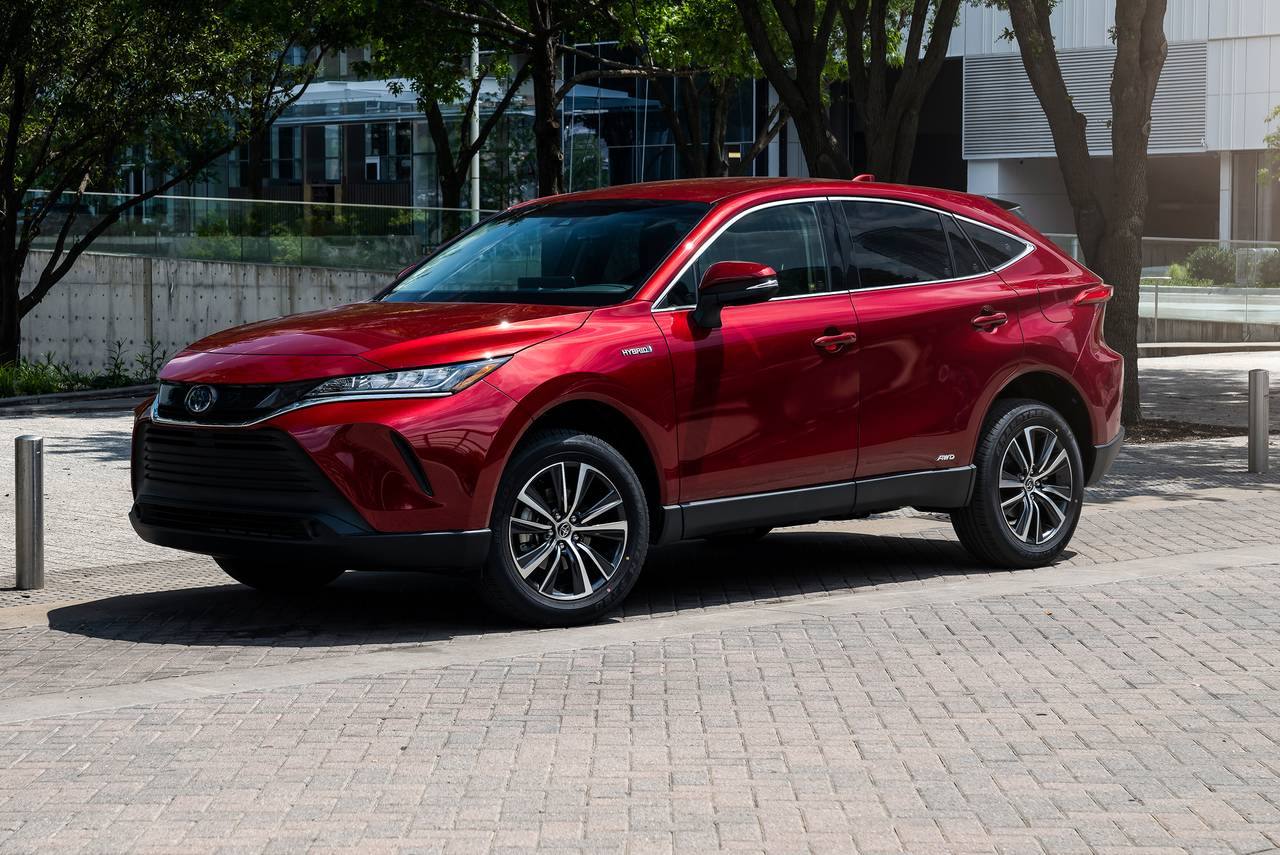
The Toyota Venza is a mid-size crossover SUV that was first released in 2009. It was discontinued in 2017 but was brought back in 2021 as a hybrid-only model. It is known for its stylish design, comfortable ride, and long list of standard features.
The Venza is available in two main configurations: LE and XLE. The LE is the base trim and comes standard with features such as a 9-inch touchscreen infotainment system, a rearview camera, Bluetooth, and a six-speaker sound system. The XLE trim adds features such as a panoramic sunroof, a JBL sound system, and heated front seats. All Venzas are powered by a 2.5L four-cylinder engine and an electric motor that produces a combined 219 horsepower and 163 lb-ft of torque. It is mated to a CVT. The Venza gets an EPA-estimated 40 mpg in the city and 37 mpg on the highway.
The Venza has a spacious interior for its size and can seat up to five passengers. It has a cargo capacity of 28.8 cubic feet behind the rear seats and 70.7 cubic feet with the rear seats folded down. The Venza is a good car for those looking for a stylish, comfortable, and fuel-efficient mid-size crossover SUV. It is not as powerful as some competitors, but it is more affordable.
Toyota Venza Sales Figures
The Toyota Venza provides a compelling option for those seeking a comfortable, efficient, and well-equipped mid-size crossover. With its hybrid powertrain, advanced technology, and focus on comfort, the Venza appeals to a wide range of buyers, from families to those seeking a more environmentally conscious and luxurious vehicle. The reintroduction of the Venza for the 2021 model year marked a significant update, and prospective buyers would be wise to consider the specific details and features of the model year in question.
Toyota Venza U.S Sales Data & Charts
US Monthly Sales
| Year | Jan | Feb | Mar | Apr | May | Jun | Jul | Aug | Sep | Oct | Nov | Dec |
|---|---|---|---|---|---|---|---|---|---|---|---|---|
| 2008 | 0 | 0 | 0 | 0 | 0 | 0 | 0 | 0 | 0 | 0 | 0 | 1,474 |
| 2009 | 1,394 | 2,315 | 3,695 | 3,793 | 4,745 | 4,521 | 5,780 | 8,435 | 4,738 | 5,035 | 4,140 | 5,819 |
| 2010 | 3,564 | 3,414 | 5,227 | 4,854 | 4,625 | 3,512 | 4,024 | 3,644 | 3,546 | 3,551 | 3,364 | 3,996 |
| 2011 | 2,387 | 2,551 | 3,177 | 3,244 | 3,207 | 3,384 | 4,711 | 3,725 | 3,445 | 3,326 | 2,610 | 3,137 |
| 2012 | 2,460 | 2,670 | 3,503 | 3,051 | 3,608 | 4,210 | 3,995 | 3,687 | 4,229 | 3,598 | 3,660 | 4,423 |
| 2013 | 3,371 | 3,745 | 3,965 | 3,297 | 3,359 | 2,875 | 2,886 | 3,496 | 2,193 | 2,272 | 2,239 | 2,148 |
| 2014 | 1,993 | 2,472 | 3,090 | 3,053 | 3,324 | 2,322 | 2,540 | 2,793 | 1,858 | 1,896 | 2,231 | 2,419 |
| 2015 | 2,105 | 2,272 | 2,404 | 2,101 | 2,298 | 2,017 | 2,229 | 2,147 | 1,584 | 1,191 | 602 | 401 |
| 2016 | 184 | 124 | 107 | 57 | 31 | 40 | 20 | 11 | 6 | 4 | 4 | 1 |
| 2017 | 4 | 1 | 4 | 2 | 0 | 0 | 0 | 0 | 1 | 0 | 0 | 0 |
| 2018 | 0 | 0 | 0 | 0 | 0 | 0 | 0 | 0 | 0 | 0 | 1 | 8 |
| 2019 | 0 | 0 | 1 | 1 | 0 | 0 | 0 | 2 | 5 | 0 | 0 | 0 |
| 2020 | 0 | 0 | 0 | 0 | 0 | 0 | 0 | 43 | 1,625 | 3,510 | 3,400 | 4,495 |
| 2021 | 3,358 | 3,753 | 6,512 | 8,112 | 9,318 | 4,781 | 5,106 | 5,329 | 4,224 | 3,251 | 2,846 | 5,128 |
| 2022 | 4,464 | 3,736 | 2,636 | 2,309 | 2,975 | 2,546 | 2,064 | 1,098 | 1,303 | 3,705 | 3,923 | 2,924 |
| 2023 | 2,888 | 2,419 | 2,159 | 1,749 | 1,570 | 2,292 | 2,790 | 3,030 | 3,190 | 2,896 | 2,369 | 2,555 |
| 2024 | 2,189 | 2,424 | 3,348 | 4,416 | 5,017 | 4,133 | 3,378 | 3,137 | 1,748 | 803 | 178 | 1,315 |
| 2025 | 502 | 131 | 39 | 0 | 0 | 0 | 0 | 0 | 0 | 0 | 0 | 0 |
| ∑ = 30,863 | ∑ = 32,027 | ∑ = 39,867 | ∑ = 40,039 | ∑ = 44,077 | ∑ = 36,633 | ∑ = 39,523 | ∑ = 40,577 | ∑ = 33,695 | ∑ = 35,038 | ∑ = 31,567 | ∑ = 40,243 |