Get your automotive data ad-free: become a premium member today!

Jeep Wrangler Sales Figures

Jeep Wrangler

Here you will find monthly and yearly Canadian, European and U.S. sales figures for the Jeep Wrangler. The Jeep Wrangler is one of the most iconic and recognizable vehicles in the world, known for its rugged design, off-road prowess, and strong ties to its military origins. It traces its lineage back to the World War II-era Willys MB Jeep, and over the decades, it has cultivated a devoted following due to its unique blend of simplicity, capability, and modifiability.

Jeep Wrangler Overview

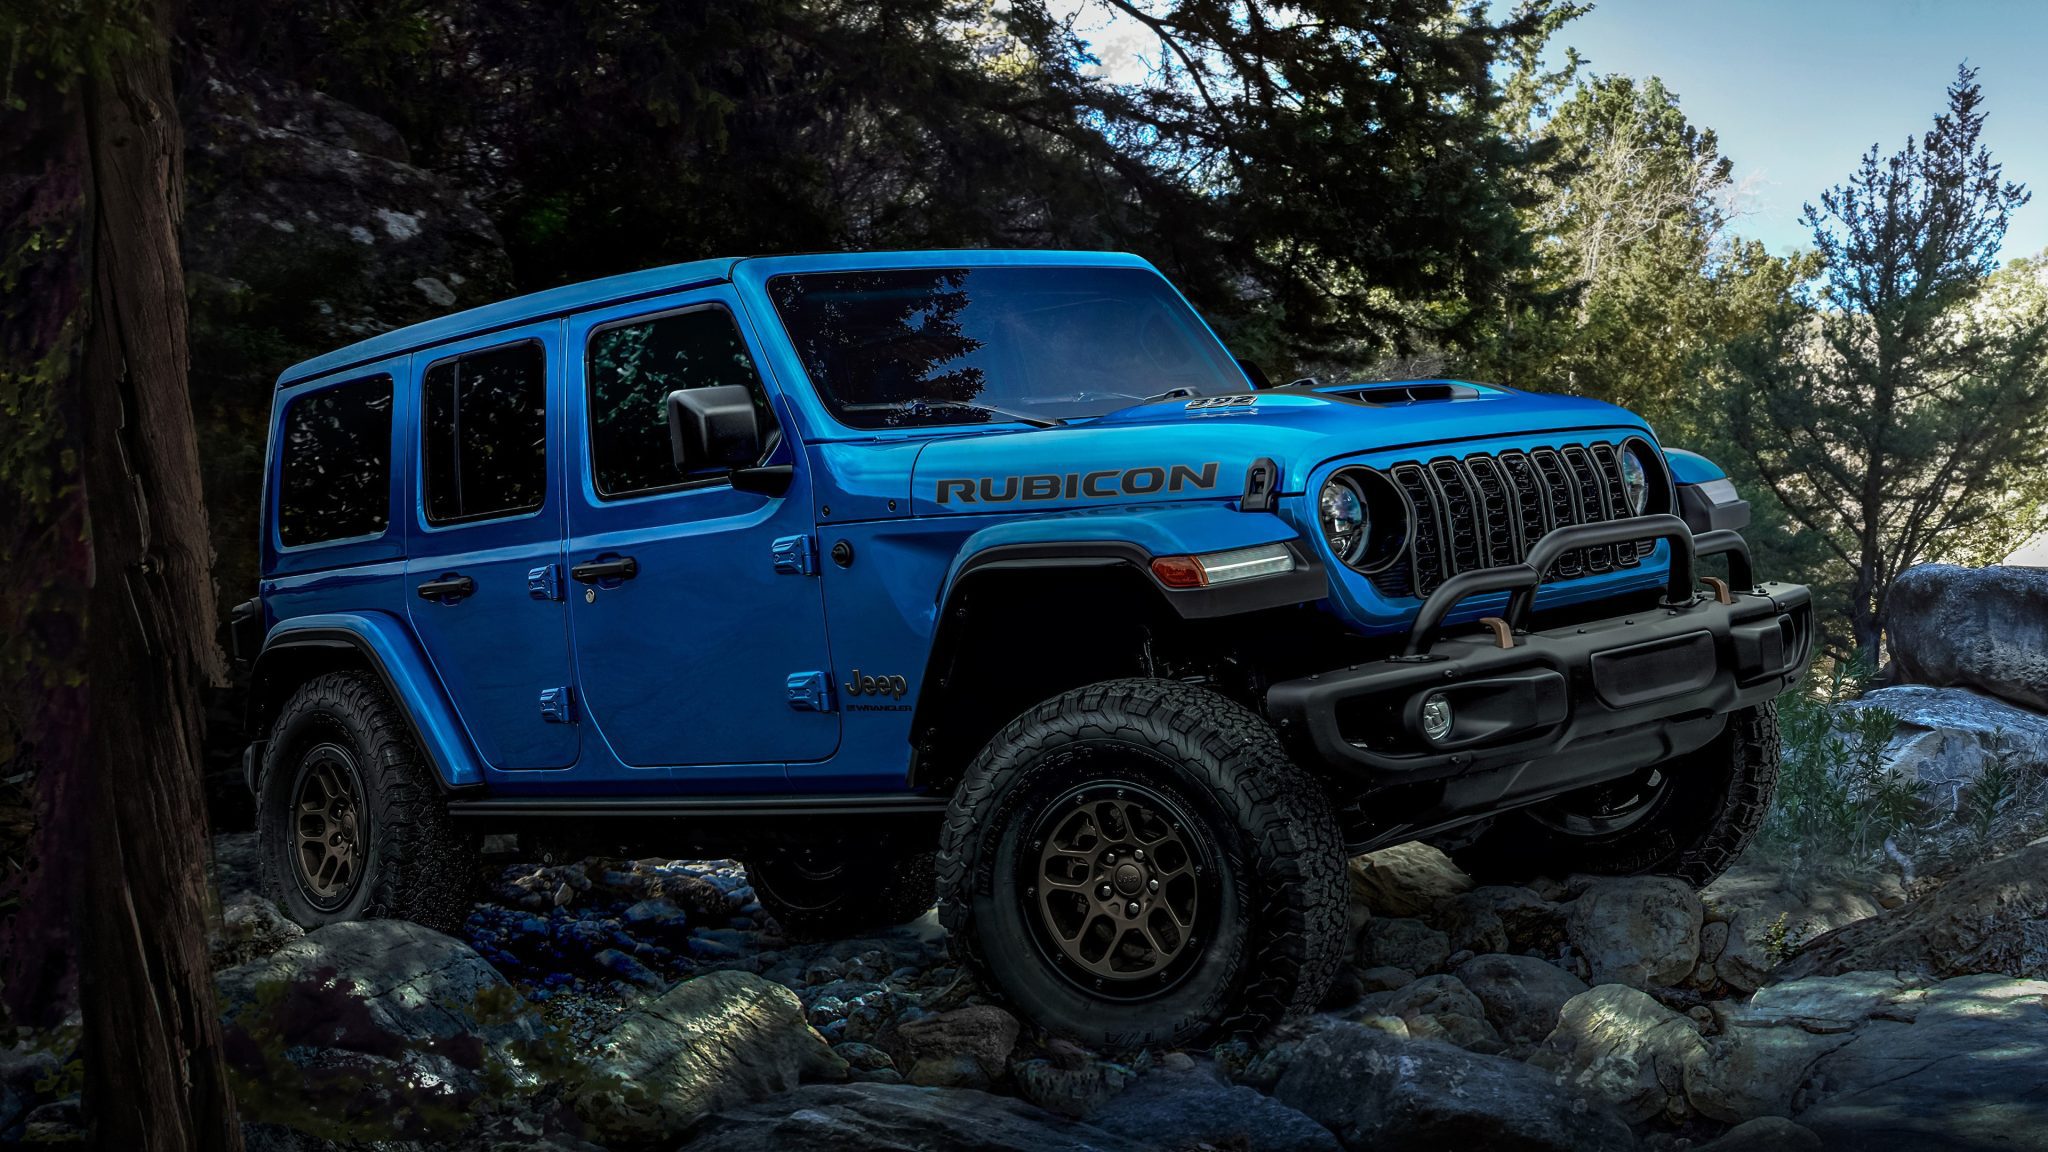
The Jeep Wrangler is a four-wheel drive SUV that was first introduced in 1986. It is currently in its fourth generation, which was introduced in 2018. The Wrangler is known for its off-road capability, rugged design, and removable doors and roof. The current generation offers improved refinement, efficiency, and technology while preserving the model’s iconic design and off-road performance. It includes features such as a modern infotainment system, advanced safety options, and lightweight materials to improve efficiency.

The current-generation Wrangler is available with a choice of two engines: a 3.6-liter V6 engine and a 2.0-liter turbocharged four-cylinder engine. Both engines are mated to an eight-speed automatic transmission. The Wrangler is available in a variety of trim levels, including the base Sport, the mid-level Sahara, and the top-of-the-line Rubicon. The Wrangler is a popular car in the United States. It has won numerous awards, including the 2018 Motor Trend SUV of the Year award.

Jeep Wrangler Sales Figures

Jeep Wrangler U.S Sales Data & Charts

US Monthly Sales

Year Jan Feb Mar Apr May Jun Jul Aug Sep Oct Nov Dec
2005 3,743 5,198 6,748 7,882 8,543 8,337 11,704 7,079 5,463 4,475 4,482 5,363
2006 3,830 5,673 8,180 6,154 5,754 5,674 7,935 6,002 5,032 8,679 8,735 8,623
2007 8,954 9,240 13,397 10,776 12,332 10,952 8,829 9,464 8,605 9,354 8,333 9,007
2008 6,137 7,088 8,589 8,699 9,260 6,670 6,093 6,469 6,130 6,292 6,140 7,048
2009 6,362 9,088 10,000 9,336 9,294 4,810 4,540 5,613 6,002 5,305 4,896 6,798
2010 4,888 5,967 8,410 8,327 9,634 8,923 10,043 7,666 7,765 7,908 6,552 8,227
2011 6,444 7,636 8,807 9,051 10,008 11,290 14,355 12,949 11,388 9,892 9,225 11,415
2012 7,896 18,638 12,557 12,184 15,454 14,461 12,216 13,293 12,097 11,310 10,337 11,545
2013 8,854 10,091 12,901 13,445 16,272 16,165 14,404 15,825 11,984 11,780 11,753 12,028
2014 9,553 10,640 14,481 15,389 19,235 16,439 16,388 17,988 13,955 13,665 13,592 14,003
2015 11,683 12,911 17,524 18,849 22,324 19,159 19,320 18,160 17,583 15,751 13,847 15,591
2016 10,797 13,234 17,710 19,003 19,551 20,060 18,741 15,290 14,255 14,469 12,957 15,721
2017 11,334 13,641 16,336 18,841 19,931 18,839 18,698 16,808 15,714 13,391 13,289 13,700
2018 11,739 15,936 27,829 29,776 25,102 23,110 21,308 20,168 15,983 13,318 15,963 19,800
2019 13,024 15,001 21,963 22,422 24,530 20,055 19,419 21,750 17,866 17,126 17,760 17,126
2020 12,884 16,680 10,103 10,163 22,585 23,714 18,960 16,853 18,258 17,242 14,163 19,705
2021 15,887 15,887 17,873 23,305 22,409 23,305 15,540 14,964 15,540 13,300 13,300 13,300
2022 14,579 14,576 16,398 18,437 17,754 17,754 15,685 16,289 15,685 11,418 10,961 11,874
2023 12,490 11,991 13,490 15,759 15,153 15,759 13,432 14,507 13,970 8,789 9,878 10,273
2024 12,601 12,601 13,105 12,629 13,134 13,134 11,801 13,217 10,857 11,230 13,183 13,672
∑ = 193,679 ∑ = 231,717 ∑ = 276,401 ∑ = 290,427 ∑ = 318,259 ∑ = 298,610 ∑ = 279,411 ∑ = 270,354 ∑ = 244,132 ∑ = 224,694 ∑ = 219,346 ∑ = 244,819

US Annual Sales

US Annual Growth

250000250000200000200000150000150000100000100000500005000000Sales Units2005200520062006200720072008200820092009201020102011201120122012201320132014201420152015201620162017201720182018201920192020202020212021202220222023202320242024#000000
Download SVG
Download PNG
Download CSV

Jeep Wrangler Canada Sales Data & Charts

Canada Annual Sales

Canada Annual Growth

Sales Units
25000250002000020000150001500010000100005000500000Sales Units20122012201320132014201420152015201620162017201720182018201920192020202020212021

Jeep Wrangler Europe Sales Data & Charts

Europe Annual Sales

Europe Annual Growth

Sales Units
90009000800080007000700060006000500050004000400030003000200020001000100000Sales Units1997199719981998199919992000200020012001200220022003200320042004200520052006200620072007200820082009200920102010201120112012201220132013201420142015201520162016201720172018201820192019202020202021202120222022