Chevrolet Suburban
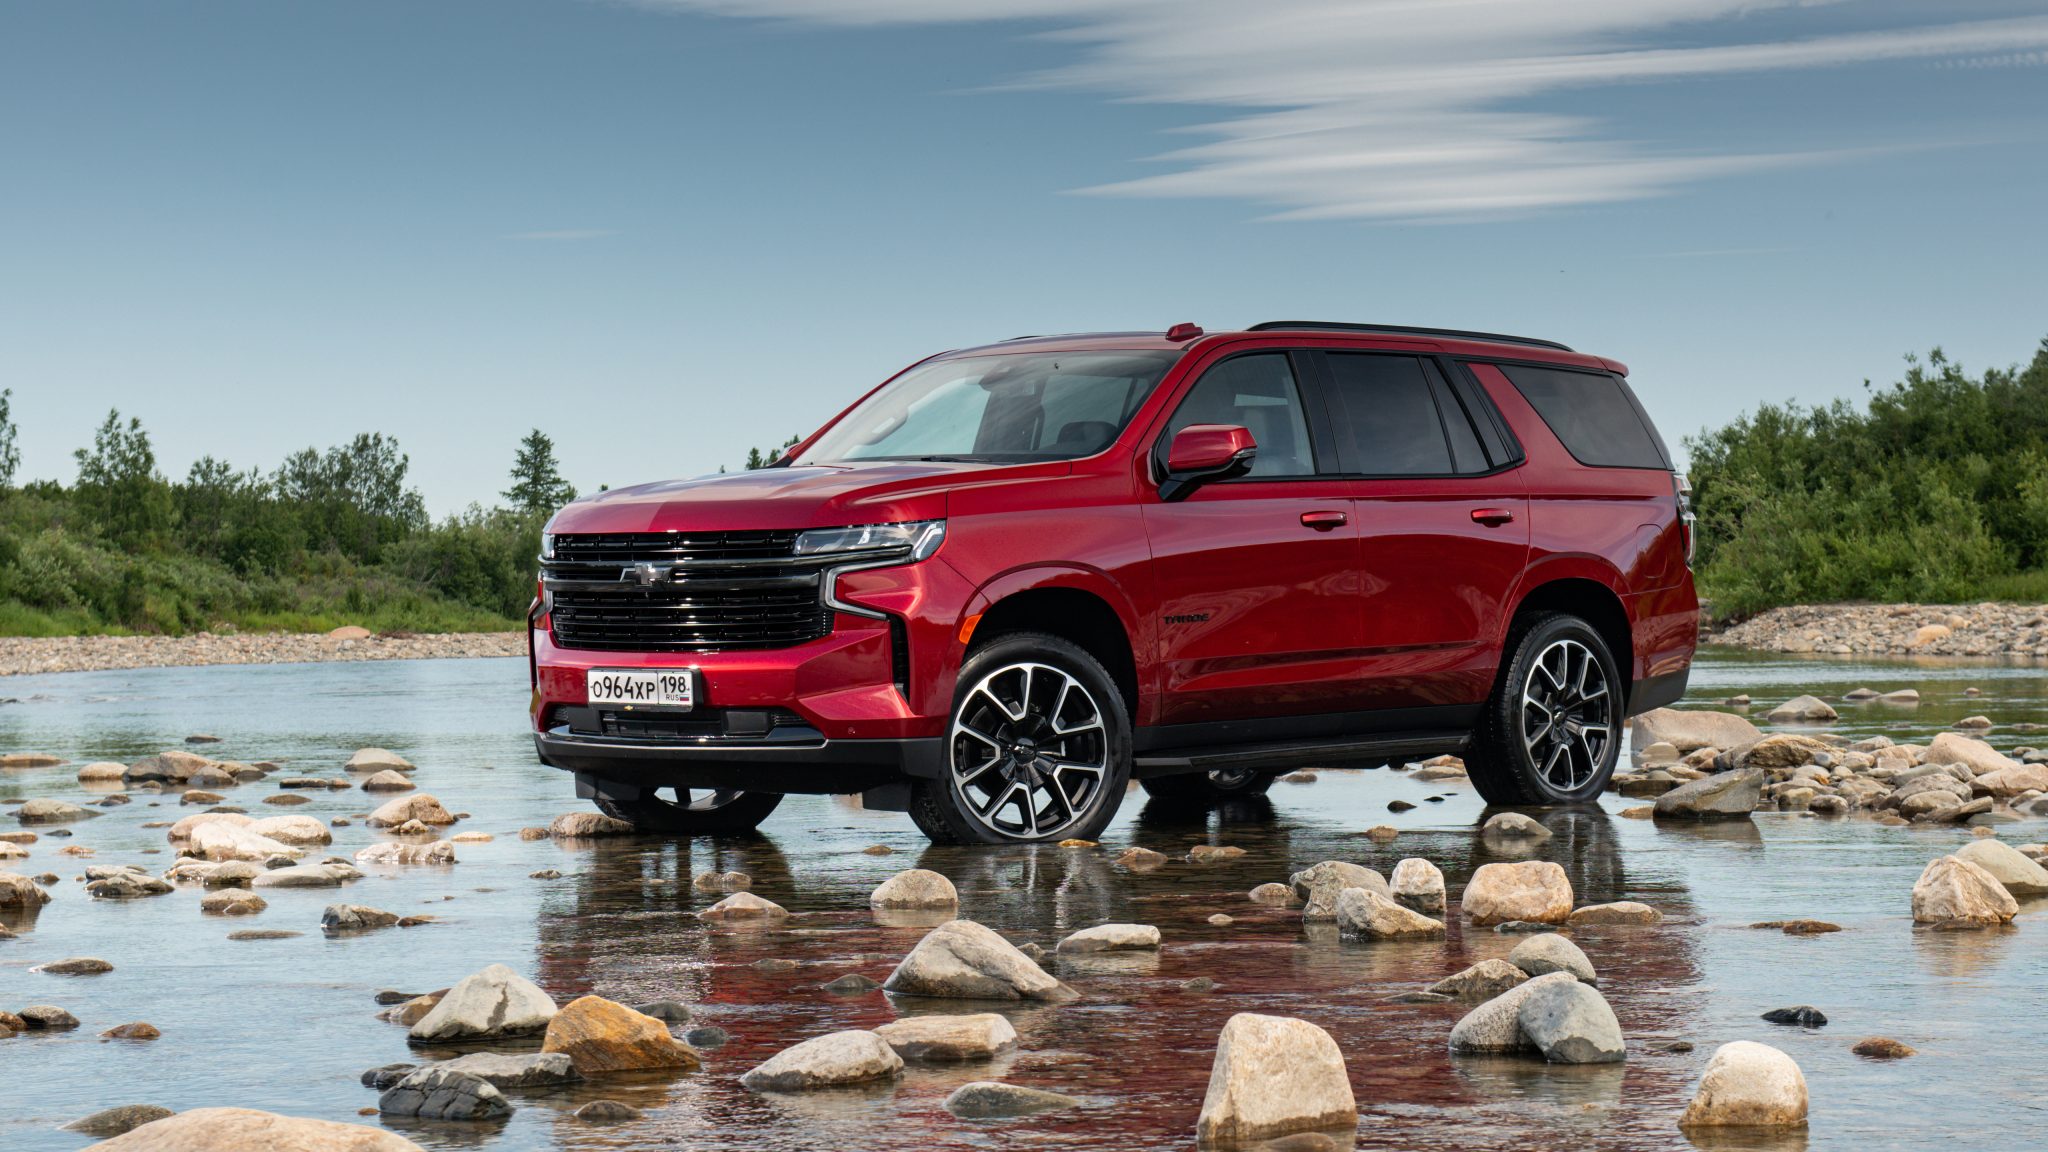
The Chevrolet Suburban is a full-size SUV manufactured by Chevrolet, a division of General Motors. Its history dates back to the 1930s, making it one of the longest-running automotive nameplates in the world. Known for its spacious interior and versatile capabilities, the Suburban has been a popular choice among families and those needing substantial hauling capacity. Whether equipped as a basic workhorse or outfitted with all the latest amenities, the Suburban’s reputation for durability and practicality has contributed to its enduring popularity.
Chevrolet Suburban Overview
The Chevrolet Suburban has long been a go-to option for those seeking a large and versatile SUV. Its substantial passenger and cargo capacity, coupled with its towing abilities, make it well-suited for family transportation, road trips, and more. The Chevrolet Suburban is a full-size SUV that has been in production since 1935. It is the longest-running nameplate in automotive history
The Suburban is currently in its 12th generation and is available in three trim levels: LS, LT, and High Country. It is powered by a 5.3L V8 engine that produces 355 horsepower and 383 lb-ft of torque. It is available with rear-wheel drive or four-wheel drive. The Suburban gets an EPA-estimated 17 mpg in the city and 25 mpg on the highway. The Suburban has a spacious interior and can seat up to nine passengers. It also has a large cargo area that can hold up to 144. 2 cubic feet of cargo.
The Suburban is praised for its spacious interior, its off-road capability, and its long list of standard features. It is also criticized for its poor fuel economy and its high price tag. Overall, the Chevrolet Suburban is a good full-size SUV that is perfect for families or those who need a lot of space. However, it is not the most fuel-efficient or affordable car on the market.
Chevrolet Suburban Sales Figures
Chevrolet Suburban U.S Sales Data & Charts
US Monthly Sales
| Year | Jan | Feb | Mar | Apr | May | Jun | Jul | Aug | Sep | Oct | Nov | Dec |
|---|---|---|---|---|---|---|---|---|---|---|---|---|
| 2005 | 5,036 | 5,526 | 7,672 | 6,230 | 7,835 | 12,482 | 12,786 | 6,866 | 5,640 | 4,237 | 4,735 | 7,966 |
| 2006 | 5,507 | 4,820 | 4,780 | 4,543 | 7,186 | 7,417 | 7,319 | 6,463 | 5,837 | 6,938 | 8,277 | 8,124 |
| 2007 | 4,951 | 6,437 | 8,282 | 6,287 | 7,044 | 5,546 | 8,243 | 8,209 | 7,551 | 8,317 | 6,033 | 6,773 |
| 2008 | 4,240 | 4,076 | 5,278 | 4,722 | 4,056 | 5,549 | 3,989 | 5,408 | 4,339 | 2,464 | 3,882 | 6,055 |
| 2009 | 2,138 | 1,451 | 2,119 | 4,424 | 2,631 | 1,958 | 3,281 | 4,101 | 5,338 | 4,231 | 4,678 | 4,705 |
| 2010 | 2,315 | 1,680 | 3,885 | 5,087 | 5,279 | 3,911 | 3,708 | 3,080 | 2,863 | 4,354 | 4,726 | 4,265 |
| 2011 | 2,343 | 2,383 | 2,959 | 3,613 | 3,954 | 3,354 | 4,265 | 4,938 | 5,246 | 4,655 | 5,787 | 5,930 |
| 2012 | 2,935 | 6,608 | 3,653 | 3,463 | 4,577 | 5,136 | 4,445 | 3,093 | 3,254 | 3,595 | 4,705 | 5,956 |
| 2013 | 2,292 | 3,745 | 3,378 | 3,682 | 4,753 | 3,813 | 6,181 | 4,003 | 2,733 | 5,648 | 5,212 | 5,820 |
| 2014 | 1,705 | 2,035 | 2,984 | 4,840 | 5,423 | 6,584 | 5,168 | 5,748 | 4,101 | 4,615 | 5,045 | 6,761 |
| 2015 | 4,130 | 4,436 | 3,310 | 4,139 | 4,375 | 2,996 | 4,609 | 4,499 | 3,521 | 3,585 | 5,216 | 6,350 |
| 2016 | 3,270 | 3,584 | 3,825 | 4,269 | 3,997 | 3,970 | 5,055 | 5,737 | 5,575 | 6,650 | 6,577 | 7,573 |
| 2017 | 5,634 | 3,922 | 3,889 | 3,228 | 3,946 | 4,284 | 3,392 | 4,777 | 5,887 | 6,246 | 5,523 | 5,788 |
| 2018 | 5,288 | 5,004 | 4,433 | 5,045 | 5,045 | 5,045 | 4,920 | 5,532 | 5,122 | 5,132 | 4,935 | 5,132 |
| 2019 | 3,628 | 3,483 | 3,918 | 5,936 | 6,850 | 5,480 | 4,076 | 4,565 | 3,750 | 3,372 | 3,497 | 3,373 |
| 2020 | 3,084 | 0 | 2,418 | 1,263 | 2,806 | 2,947 | 2,647 | 2,353 | 2,549 | 4,580 | 3,762 | 5,235 |
| 2021 | 3,566 | 40,509 | 4,011 | 4,516 | 4,342 | 4,516 | 3,263 | 3,142 | 3,263 | 4,677 | 4,677 | 4,677 |
| 2022 | 3,976 | 3,976 | 4,473 | 3,041 | 2,928 | 2,928 | 4,471 | 4,643 | 4,471 | 5,348 | 5,134 | 5,562 |
| 2023 | 4,583 | 4,400 | 4,950 | 5,626 | 5,409 | 5,626 | 3,873 | 4,183 | 4,028 | 3,337 | 3,337 | 3,470 |
| 2024 | 3,186 | 3,186 | 3,313 | 3,824 | 3,977 | 3,977 | 2,977 | 3,334 | 2,739 | 4,095 | 4,807 | 4,985 |
| 2025 | 4,531 | 4,350 | 4,713 | 0 | 0 | 0 | 0 | 0 | 0 | 0 | 0 | 0 |
| ∑ = 78,338 | ∑ = 115,611 | ∑ = 88,243 | ∑ = 87,778 | ∑ = 96,413 | ∑ = 97,519 | ∑ = 98,668 | ∑ = 94,674 | ∑ = 87,807 | ∑ = 96,076 | ∑ = 100,545 | ∑ = 114,500 |